 Posted Feb 22, 2017, 6:54 AM
|
 |
Registered User
|
|
Join Date: Dec 2016
Location: San Francisco
Posts: 24,177
|
|
This is another article about the report:
Quote:
Benchmarking San Francisco versus Sixteen Peers
February 21, 2017
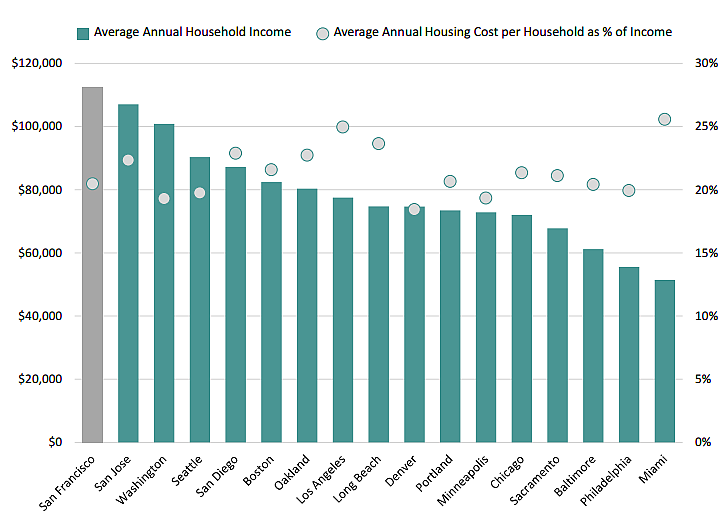
San Francisco had the highest average household income ($112,459) among its peers (which averaged $78,923), but also the highest cost of living (164 percent of the national average) and 63.4 percent of its housing units are renter-occupied (the third-highest among its peers which averaged 55.5 percent).
At the same time, there are over 100,000 San Franciscans living in poverty, a rate of 12.4 percent versus a peer average of 11.9 percent. Sixteen (16) percent of San Francisco’s population is food insecure – meaning they lack access to enough food for an active, healthy lifestyle – compared to a peer average of 13 percent. And as of two years ago, San Francisco’s homegrown rate of homelessness was 66 percent higher than its peer average but below that of Washington D.C., Boston and Denver.
San Francisco has the highest population density (18,176 people per square mile) versus its peers (which averaged 8,863 people per square mile), which might provide some context for MUNI’s average bus speed of 8.1 miles per hour while in service, the slowest bus speed among the peer set which averaged 11.2 miles per hour.
San Francisco provides 121 acres of park space per square mile (versus a peer average of 86) and spends over $210 per resident on parks and recreation (compared to a peer average of closer to $150).
San Francisco’s population has the highest incidence of Chlamydia and prevalence of HIV.
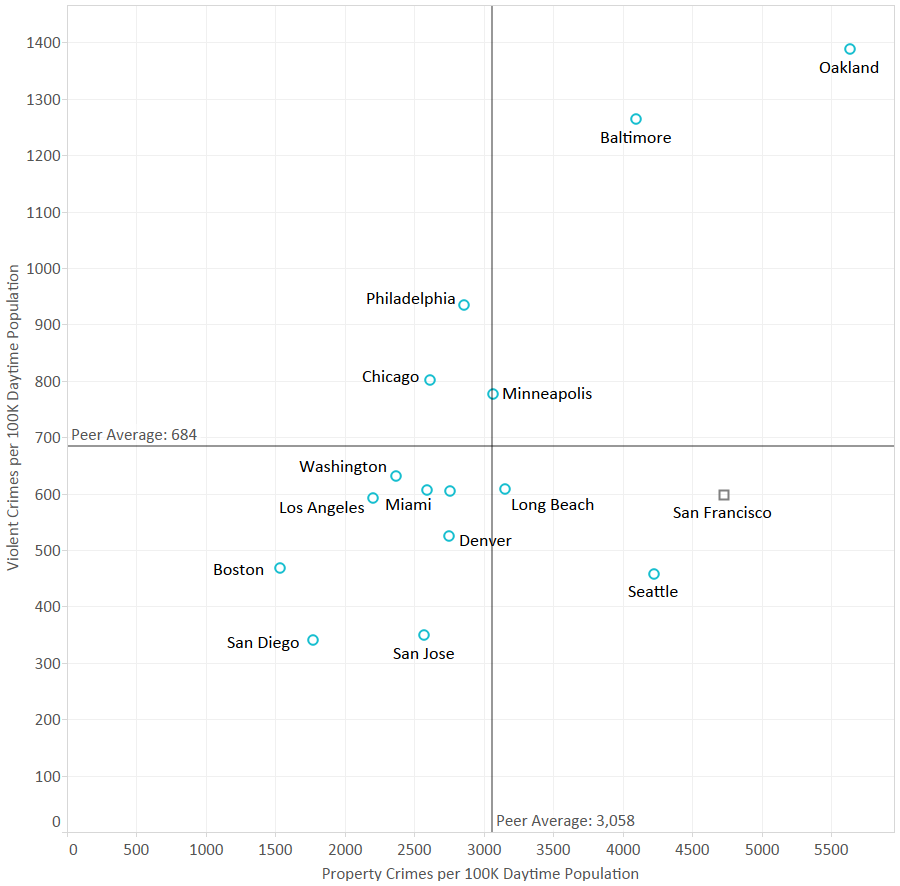
And while San Francisco appears to have the second highest property crime rate among its peers, its violent crime rate was the seventh lowest and roughly 15 percent below average.
|
http://www.socketsite.com/archives/2...er-cities.html
__________________
Rusiya delenda est
|