HomeDiagramsDatabaseMapsForum About
     

Go Back   SkyscraperPage Forum > Discussion Forums > City Discussions


Reply

 
Thread Tools Display Modes
     
     
  #161  
Old Posted Oct 2, 2012, 2:59 AM
memph memph is offline
Registered User
 
Join Date: Dec 2010
Posts: 1,854
Quote:
Originally Posted by animatedmartian View Post
Detroit had a relatively small areas of high density. The red areas had up to 70-80,000 ppsm in 1950 (going by census blocks). The area in green (Hamtramck) had 20,000 ppsm. Everywhere else pretty much was a decrease in density until you reached the rural areas which was about a dozen miles out during that time.


What kind of building stock did those red areas have? Was it mostly houses or were there lots of apartment buildings? With today's levels of living space per person, you'd need low-mid rise apartment buildings (depending on lot coverage) to achieve those kinds of densities.
Reply With Quote
     
     
  #162  
Old Posted Oct 2, 2012, 3:25 AM
animatedmartian's Avatar
animatedmartian animatedmartian is offline
Registered User
 
Join Date: Nov 2010
Posts: 2,952
Quote:
Originally Posted by memph View Post
What kind of building stock did those red areas have? Was it mostly houses or were there lots of apartment buildings? With today's levels of living space per person, you'd need low-mid rise apartment buildings (depending on lot coverage) to achieve those kinds of densities.
Hard to say which one dominated. In the northwest red area, for example, you had single family housing...

http://goo.gl/maps/qk0M2

...and then two family flats on the next street over...

http://goo.gl/maps/ExyRx

..with larger multifamily apartment buildings limited to the arterial roads (most of them at least).

http://goo.gl/maps/1UAKr

The downtown area seems to have larger apartment buildings, but still quite a lot of SFH mixed in.

http://goo.gl/maps/b5m4T

http://goo.gl/maps/2Psg8
Reply With Quote
     
     
  #163  
Old Posted Oct 16, 2012, 6:45 PM
M II A II R II K's Avatar
M II A II R II K M II A II R II K is offline
Registered User
 
Join Date: Aug 2002
Location: Toronto
Posts: 52,200
America's Truly Densest Metros


Oct 15, 2012

By Richard Florida

Read More: http://www.theatlanticcities.com/hou...t-metros/3450/

Patterns of Metropolitan and Micropolitan Population Change:
2000 to 2010 PDF:
http://www.census.gov/prod/cen2010/r...c2010sr-01.pdf

Quote:
Economists and urbanists have long argued that density plays a key role in innovation and economic growth. As important as it is, density is a tough thing to measure. Metros come in different shapes as well as sizes: Some have more concentrated populations near the center, others are more continuously sprawling. Yet, density is typically measured rather crudely by simply dividing the total population of a city or metro area by its land area.

- A new report from the U.S. Census Bureau helps to fill the gap, providing detailed estimates of different types of density for America's metros. This includes new data on "population-weighted density" as well as of density at various distances from the city center. Population-weighted density, which essentially measures the actual concentration of people within a metro, is an important improvement on the standard measure of density.

- For this reason, I like to think of it as a measure of concentrated density. The Census calculates population-weighted density based on the average densities of the separate census tracts that make up a metro. The differences in the two density measures are striking. The overall density across all 366 U.S. metro areas is 283 people per square mile. Concentrated or population-weighted density for all metros is over 20 times higher, at 6,321 people per square mile.

- What's particularly useful about the new Census report is that it provides detailed data on population-weighted density for all U.S. metros for both 2000 and 2010 (full data set here [xls]). This took some doing, because metro boundaries change over time. To develop consistent estimates, Census researchers went back and recalculated population-weighted densities for 2000 based on the revised metro boundaries for 2010. This makes it possible to compare the two time periods and examine changes over time.

- New York and Los Angeles are good examples of the differences between these two density measures. While they are close in the average density — 2,826 for New York versus 2,646 for L.A. — the New York metro has much higher levels of concentrated or population-weighted density, 31,251 versus 12,114 people per square mile. San Francisco, which has lower average density than L.A. (1,755 people per square mile), tops L.A. on population-weighted density with 12,145 people per square mile. New York's population-weighted density is much higher than L.A.'s in close proximity to city hall, roughly 80,000 people per square mile compared to between 20,000 or 30,000 for L.A., but it dips substantially about 15 miles out from the city center, falling beneath that of L.A.

- Density has long been seen as a key factor in the ability of cities to innovate and grow, but exactly how it does so remains an open question. Rappaport's study, in fact, suggests that there is not a one-to-one relationship between density and productivity, noting that the "productivity required to sustain above-average population densities considerably exceeds estimates of the increase in productivity caused by such high density." Silicon Valley remains tremendously innovative at medium levels of density. The world's densest cities in Asia and elsewhere can take the form of skyscraper districts which limit interaction and function as kind of vertical sprawl.

.....


Population-Weighted density across U.S. metros.


Tracking density, as well as the distribution of population, in the two metros by distance from the city center (measured as the distance from city hall).

__________________
ASDFGHJK
Reply With Quote
     
     
  #164  
Old Posted Dec 4, 2012, 5:59 AM
Chicago103's Avatar
Chicago103 Chicago103 is offline
Future Mayor of Chicago
 
Join Date: Mar 2003
Location: Chicago
Posts: 6,060
One more subtle difference I have noticed is that in New York City double street frontage is more common than in Chicago. What I mean by "double street frontage" is that in Chicago's residential neighborhoods it is common for the long block frontages (usually north-south streets but sometimes east-west) to have housing fronting them but the short block frontages (usually east-west streets, on the south side they are numbered) are simply pass through streets with little housing facing them or at the very least significantly less, this is no doubt to accomidate the alleys, this is what I would call "single frontage". New York City on the other hand, even in eastern Queens and Staten Island often have houses fronting all the streets. So wheras with single frontage you have just two corner houses on the short blocks you have four or five houses facing the street on short blocks with double frontage.
__________________
Devout Chicagoan, political moderate and paleo-urbanist.

"Auto-centric suburban sprawl is the devil physically manifesting himself in the built environment."
Reply With Quote
     
     
  #165  
Old Posted Dec 4, 2012, 3:29 PM
Segun's Avatar
Segun Segun is offline
<-- Chicago's roots.
 
Join Date: Aug 2001
Posts: 5,929
Quote:
Originally Posted by M II A II R II K View Post
America's Truly Densest Metros


Oct 15, 2012

By Richard Florida

Read More: http://www.theatlanticcities.com/hou...t-metros/3450/

Patterns of Metropolitan and Micropolitan Population Change:
2000 to 2010 PDF:
http://www.census.gov/prod/cen2010/r...c2010sr-01.pdf


Population-Weighted density across U.S. metros.
Interesting find, I find the Bay to be similar to LA outside of SF, though with better transit and a lot less cities. Wonder what it would be with San Jose added to it?
__________________
Songs of the minute - Flavour - Ijele (Feat. Zoro)
https://www.youtube.com/watch?v=KjEFGpnkL38

Common - Resurrection (Video Mix)
https://www.youtube.com/watch?v=HmOd0GKuztE
Reply With Quote
     
     
  #166  
Old Posted Dec 4, 2012, 3:58 PM
JDRCRASH JDRCRASH is offline
Registered User
 
Join Date: Mar 2007
Location: San Gabriel Valley
Posts: 8,087
Quote:
Originally Posted by M II A II R II K View Post
America's Truly Densest Metros
Population-Weighted density across U.S. metros.

In the next couple decades that little "hill" on the top graph is gonna be WAAAY longer and a little higher.
__________________
Revelation 21:4
Reply With Quote
     
     
  #167  
Old Posted Dec 4, 2012, 4:05 PM
mhays mhays is online now
Never Dell
 
Join Date: Jul 2001
Posts: 19,786
That's true, though you might mean a different chart.

We talk about downtown highrises a lot here. But a lot of cities are also densifying other neighborhoods, both extending the downtown periphery outward, and gaining true urban densities farther out.
Reply With Quote
     
     
  #168  
Old Posted Dec 5, 2012, 11:52 PM
Chicago103's Avatar
Chicago103 Chicago103 is offline
Future Mayor of Chicago
 
Join Date: Mar 2003
Location: Chicago
Posts: 6,060
Houston looks as empty as Detroit from much of the google street views I have seen. Obviously for slightly different reasons, in the case of Detroit because of the massive decline and in Houston because it has almost rural looking old housing just a mile or two outside the CBD. This includes even the areas west of downtown which should be most vibrant and even there much of the housing could pass for some random small town in Arkansas or something. I would say as far as New York City and Los Angeles are apart in density patterns that is how far Los Angeles is from what I have seen of Houston. I figure some of the CBD transitional neighborhoods of old in Houston must have been leveled for the construction of the expressways and for urban renewal and parking lots but man I am shocked at how empty parts of central Houston look. I don't mean to be a downer about Houston, could someone familiar with it direct me to areas that have more dense urban and prefereably older housing stock streetviews?
__________________
Devout Chicagoan, political moderate and paleo-urbanist.

"Auto-centric suburban sprawl is the devil physically manifesting himself in the built environment."
Reply With Quote
     
     
  #169  
Old Posted Jan 30, 2013, 1:13 AM
nei nei is offline
Registered User
 
Join Date: Apr 2012
Posts: 515
Quote:
Originally Posted by 10023 View Post
Some more London/NY comparisons:

The only London borough that matches Brooklyn's density is Kensington & Chelsea, and it's only 4.7 square miles (vs. Brooklyn's 71 square miles).

"Inner London" by the ONS defintion has 2,985,700 people in 123 sq. miles (24,274 ppsm). Even without Manhattan, Brooklyn and the Bronx have 3,924,647 people in 113 square miles (34,731 ppsm). Brooklyn alone is almost as populous as and significantly denser than Inner London with 2,532,645 people in 71 square miles (35,671 ppsm).

Greater London has 7,753,600 people in 607 square miles (12,774 ppsm). New York City's five boroughs have 8,244,910 people in just 305 square miles (27,032 ppsm). NYC crams more people into roughly half the space.

For a close-ish comparison by area, the five NYC boroughs plus the New Jersey counties of Hudson, Essex and Union* have a population of 10,199,644 people in 581 square miles (17,555 ppsm). If you added enough of inner Westchester or Nassau counties to get to Greater London's area exactly, there's probably close to 10.5 million people.


* These three surround the harbors and include Hoboken, Jersey City, Union City and Newark. All of the other suburban counties around NYC are much larger in area (e.g., Westchester is 500 square miles, Nassau is 453 square miles) and include a lot of open space, so densities are only a few thousand ppsm).
I had a graph with London densities compared to New York City and Chicago (metro):

And a graph with London. No idea where to find district densities for Paris in a text form I could deal with using Excel or a computer program, so no Paris on the graph. The development of London is rather different than most American cities. Greater London itself is mostly continuous development, though the outer parts are rather patchy, as shown in the previous post. But on the edge of Greater London, is a very wide greenbelt (for whatever reason on this forum Portland rather than London is used as an example for a city with an urban growth boundary, but IMO London is a better example) with much recent "suburban" development leap frogging past the Greenbelt. This area is referred to as the commuter belt, or parts the "stockbroker belt". If we're going by urban area (area with continuous development), the urban area of London would be roughly the same as Greater London. If we're going by metro (area connected by employment), towns and cities well past that should be included increasing the population by about 50%. For most American metros, the difference between the two is small. Because of the large difference, I graphed both. For metro London, used the EU's definition of Larger Urban zone, with the districts listed here, totalling 11.6 million in 2001. Commuter Belt "London Urban Zone" is in red while Greater London "London" is in orange.


Even still, my graphs miss portion of American metros. Some outer parts of the NYC metro are missing (missed about 1/6 of the lowest density portions of the metro). And LA does not include the Inland Empire and a few other outlying areas. Might fix later, but doesn't really affect the lower parts of the graph too much.

The top part of the London graph doesn't seem dense enough. The outer parts of the London metro are still rather compact, built around satellite towns rather than detached homes on large lots. For example, 7000 people per square mile is about the density of residential neighborhoods in Levittown. Few areas of London, even outside the "city limits" (Greater London) look that spread out. I have trouble believe 25% of the London metro is less dense than Levittown. This neighborhood looks it might be more spread out, but it doesn't seem typical something like is much common.

The cause I can guess is that the areas I graphed (LSOAs) are drawn differently than US census tracts. Census tracts are drawn to follow neighborhood geography (usually). Areas with low residential population are often grouped in a separate tract with not much people. The LSOAs are drawn so that they each have the same population (about 1500), so non-residential areas might drag down the density of tracts near, say a park while for a census tract the low population density wouldn't drag the density down as much on the graph since the non-residential areas would be contained within census tracts with few people. The denser tracts shouldn't be affected much, as those areas are all built up anyway. Anyway, the bottom part of the London urban zone graph is probably reasonable but the top part (especially for the London Larger Urban Zone) probably isn't, and I'm guessing the London Urban Zone curve should follow the Greater London curve on the top part.

Assuming the bottom part is correct, London has a denser core than any city in the US besides NYC, but is much less dense than NYC, which isn't surprisingly as the bulk of it is row houses. Its density profile is rather flat; similar to Los Angeles but denser throughout. Numbers I used were 2001 numbers, city has seen fast growth since then. The weighted density of Greater London is about 21,000 per square mile with 7.2 million people. Inner London has 2.5 million at a density of 21,000 or a weighted density of 31,000.

When I have a chance, I'll make graphs for other British cities. Might just graph the city cores, as determing where the metro/urban area ends is difficult and I have trouble trusting the numbers.
Reply With Quote
     
     
  #170  
Old Posted Jan 30, 2013, 1:17 AM
nei nei is offline
Registered User
 
Join Date: Apr 2012
Posts: 515
A bunch of maps with detailed stats on Paris and London, as well a map comparing American cities at the beginning of the post:

I found a few density maps that might be of interest.

http://sabinawolfson.com/misc/Figure04_CensusPop.pdf

First, a density map of four US cities (DC, NYC, Boston and Chicago) mapped with their rapid transit lines (and for Boston, the Green Line, too) at the same scale. The units, people per meter squared, are rather goofy. It's easy to transform the numbers to more normal metric units, for people per hectares, multiply by 10,000. For people per square kilometer, multiply by 1,000,000. Here's the per square mile conversion so people who want those units don't have to convert:

Lightest color — 0 - 15,500 per square mile (0 -60 per hectare)
2nd Lightest color — 18,100 - 38,800 per square mile (70 -150 per hectare)
3rd Lightest color — 41,400 - 72,500 per square mile (160 - 280 per hectare)
4th Lighest color — 75,100 - 119,100 per square mile (290 - 460 per hectare)
5th Lightest color — 121,700 - 230,400 per square mile (470 - 890 per hectare)

Seems like the map maker rounded to the nearest 10s people per hectare so there is no in between. For each city:

1) DC has less dense areas (areas not the lightest color) than the other four cities. For whatever reason the map doesn't show subway lines past the city limits. A subway line covers the densest residential neighborhood, and a few others seem go close to dense neighborhoods but they don't seem follow population density too carefully. Perhaps they were placed to serve city attractions / centers?

2) Many of the denser areas of Boston have a subway line (or Green Line) but a large area in southern Boston (Dorchester) is poorly served. A bunch of denser areas in the Northeast outside of the city are missed as well. The Orange line north of Downtown seems to be placed in a way to miss the most residents possible, the Green Line E extension should fix the gap in between the Red and Orange line.

The densest neighborhoods of Boston around downtown are mainly to the west. There's nearly as much dense neighborhoods to the north (outside the city limits) as to the south (within the city limits) of that axis.

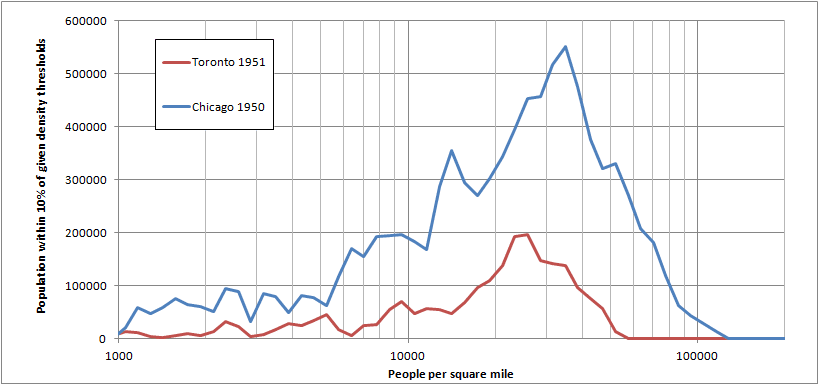
3) Chicago's dense areas take up almost the same amount of area as New York City, but those areas are much less dense; it could be described as Boston levels of density continued for the same area as New York City. The subway seems to cover the denser areas of the North Side, but is hit or miss for the rest of the city.

4) For New York City, density and having a subway line proximity follow each other rather well. Most areas near a subway line are of the darker 3 colors (above 41k / sq mile) and few of those densities are found away from a subway line. The difference is stark that you could divide the city into the parts near and not near a subway. Of course many of the low density areas not covered by the subway could just be non-residential areas. This map shows a more nuanced picture, but I have no clue what the key is:

http://farm1.staticflickr.com/71/223...59509d3b_o.jpg

A lot of the no subway areas just have no residents (for example, parkland) but the remaining no subway areas still look less dense. Did subways cause growth, or were subways built in areas already dense and built-up? For all but Upper Manhattan, subways came after development in Manhattan. For parts of Brooklyn, the development doesn't seem to cluster around subways much; it's rather even; my guess is subways followed at least as much as it spurred development. For some of the Queens lines, I think it's obvious subways spurred development. By density, it looks the NYC metro could be divided this way:

I) Manhattan, blocks of 5-6 story buildings with no setback, often with mid-rise buildings mixed in. Some neighborhoods have high rises as well. A road lined with stores on the first floor of these buildings are almost always within 1-2 blocks away. Parts of the West Bronx is at a similar density.

II) Outer Borough subway neighborhoods. Mostly from 40,000 - 75,000 people per square mile, much of the building stock is attached 3-4 story attached homes with some higher (see above) and lower density housing mixed in.

III) Outer borough neighborhoods away from the subway. Lower density sections aren't too different from older inner-ring suburbs and are often thought as "suburban", especially by those living in parts I & II. Much of it is detached homes, but still denser and with more apartment buildings and attached homes than developments further out. Only transit is buses and low frequency commuter rail, but still has high transit usage for American standards.

IV) Newer, lower density suburbia, almost all outside the city limits. Detached homes have larger lots than (III), many older suburbs belong with (III).

Leaving the US, here's Paris (most links via Rozenn):

Here's a density map of the entire metro:

On this website, you have some Ile-de-France interactive maps:
IAU - Cartographie Interactive

Click on “Population, habitat et ville” on the “thématiques” list to the left. If you want to switch maps, click on « Liste des Cartes ».

“Les densités de population en 2006”: Ile-de-France population density map. To go from people / hectare to square miles, multiply by 260. To get the density of an individual district, first choose the i on the top left and select density. Now click on any district and you get the number.

judging from the map, it looks there's plenty of the metro living at Manhattan densities (> 300 per hectare). A more detailed map of just in and around Paris proper shows the highest density districts are clustered around the center, particularly to the northeast:

http://projet36belleville.hautetfort...1074293461.png

The low density in the middle shows where the CBD is. (Ditto with Manhattan, a large drop in residents is visible in Midtown). It's hard to judge from the map, but it seems like not too much of the metro is in the red color, which is roughly the same as the "3rd lightest color" for the American city map. This is roughly neighborhood type II of NYC —*outer boroughs near subway. There's a bit of red adjacent to the city, especially to the northwest, and some in centers of individual cities surrounding Paris, but otherwise it looks less common than higher and lower densities. So Paris seems to have mostly neighborhoods at densities similar to the above NYC types I and III but not so much II and IV. A glance at streetview also seems to show there isn't much that resembles types II and IV around Paris. Maybe not coincedentally, the Paris Metro barely goes past the city limits, and seems like it would only service the densest neighborhoods in the metro. The rest of the lower density metro is serviced by high-frequency "commuter" rail and buses. Paris metro outside the city looks rather even, dense pockets (older bocks or new apartment buildings) maybe near a train station surrounded stretches of relatively less dense land (50-100 people / hecatare). I wonder what explains the sudden drop between city proper and outside? Maybe:

1) Paris is older than New York City; the highest density areas (such as most of Paris) were built up at a time when the only transportation mode available was walking. There isn't as much as drop for in neighborhood density between the modes for New York City, but both cities built their rail system differently

2) Until some time, something like city walls or legal rules concentrated development similar to how water concentrats development on an island

On the map, if you choose "Liste des Cartes" and then “Cartothèque: La population de 1876 à 2009 » : population by district over the time, that might help give an answer if you knew more details on the city's history. One of the better visualization of city growth and suburbanization I've seen anywhere.

Now to London:

London LSOA Atlas

(click population density, obviously)

London doesn't really reach the high densities of much of New York City or Paris. It still has a dense core "Inner London", much of which is above 130 people / hectare (33k / sq mile). Again, like Paris and New York City, the CBD stands as a low density section surrounded by some of the highest density housing in the city. There's a break of residential between the Westminster CBD and the City of London CBD. Outside Inner London, population density is patchier and goes down to about half or a third of "Inner London". Looking carefully at parts of North London, the highest density patches are often near London Underground stops. London Underground stop spacing is larger than local NYC subway service, more like express service or Paris RER stop spacing, so it's not surprising that the build-up looks less continuous. From I remember, Outer London tended to have a dense concentration of housing and shops right near a London Underground station. Further away, the density was less until there was often undeveloped land or just non-residential land used for more auto-oriented, space consuming commercial or industrial development. It felt like a less urban system overall, with many of the outer parts surface rail rather than underground or elevated, and each stop was for a neighborhood center. Outer London's development looks rather patchy.
Reply With Quote
     
     
  #171  
Old Posted Jan 30, 2013, 11:49 AM
10023's Avatar
10023 10023 is offline
Registered User
 
Join Date: Jun 2007
Location: London
Posts: 21,146
I think that graph would be a bit more intuitive if the X-axis showed declining rather than increasing densities (i.e., start with ~150k on the left). Perhaps that's just me but that would visualize how we think about it (denser in the core and then "trailing off" as you get further away) when reading from left to right.
Reply With Quote
     
     
  #172  
Old Posted Jan 30, 2013, 1:14 PM
Nantais's Avatar
Nantais Nantais is offline
aka GM on SSC
 
Join Date: Jun 2005
Location: Nantes, Rezé
Posts: 844
Quote:
Originally Posted by Rail Claimore View Post
France was also the major European country least bombed during the war. Not having to rebuild always helps.
A bit late, but I had to say you are particularly wrong. France was one of the most bombed country during the WW2, just behind Germany and Japan, but more than UK.
Entire cities were wiped out (Brest, Le Havre, Lorient, Cherbourg, Caen, Royan, Saint-Nazaire, etc.) while others suffered lot of damages (Rouen, Nantes, Marseille, etc...). And most of our infrastructure (bridges, roads, railways, factories, harbours, etc.) was also destroyed by the end of the war. The fact that Paris was spared shouldn't hide the fact that France was on the whole heavily bombed.

So saying that France didn't have to rebuild after WW2 was... wow... really ignorant.
Reply With Quote
     
     
  #173  
Old Posted Jan 30, 2013, 3:10 PM
iheartthed iheartthed is online now
Registered User
 
Join Date: Oct 2009
Location: New York
Posts: 9,860
Quote:
Originally Posted by animatedmartian View Post
I suspect had this area survived, it would have likely been genetrified due to it's proximity to the core (like many other cities). But looking at it now, it doesn't seem too appealing. Yet the urban frabric is still there for high density redevelopment. The question is just whether or not the demand for high density development is there.
I don't have too much faith. A lot of those near east side neighborhoods will need to have the housing completely rebuilt from the ground up should they ever become inhabited neighborhoods again. But the type of new residential development that Detroit has allowed in areas outside of downtown in the past two decades has all been low density, suburban style single family housing. It's pretty stupid.
Reply With Quote
     
     
  #174  
Old Posted Jan 31, 2013, 3:46 AM
Chicago103's Avatar
Chicago103 Chicago103 is offline
Future Mayor of Chicago
 
Join Date: Mar 2003
Location: Chicago
Posts: 6,060
There are from Thundertubs' great photo thread http://forum.skyscraperpage.com/showthread.php?t=203655. They show great examples of some of the more intensely dense neighborhoods of Chicago very well.

W. 32nd Pl. | Bridgeport


This has somewhat of the street wall effect I showed earlier that is so common in NYC, still in Chicago where this does happen it is typically at most 4 stories as shown here whereas in NYC it would be 5-7 story buildings.


rowhouse density, similar to Brooklyn but much less common in Chicago.


A house more typical of average Chicago density surrounded by high density buildings


__________________
Devout Chicagoan, political moderate and paleo-urbanist.

"Auto-centric suburban sprawl is the devil physically manifesting himself in the built environment."
Reply With Quote
     
     
  #175  
Old Posted Jan 31, 2013, 4:28 AM
dc_denizen's Avatar
dc_denizen dc_denizen is offline
Selfie-stick vendor
 
Join Date: Oct 2005
Location: New York Suburbs
Posts: 10,999
Awesome pics..

Reminds me of Segun's epic walk down Milwaukee Ave from years and years ago.
Reply With Quote
     
     
  #176  
Old Posted Jan 31, 2013, 9:04 AM
easy as pie's Avatar
easy as pie easy as pie is offline
testify
 
Join Date: May 2012
Location: 94109
Posts: 853
Quote:
Originally Posted by animatedmartian View Post


Dramatic difference today.

that's one of the most depressing things i've ever seen, like almost hard to believe.

also, chicago103: fantastic photo set, chicago looks great. as an aside, let me also mention that i really like these chicago/nyc posts of yours, the astonished updates and thoughts on how nyc could be so colossally grander than chicago are kind of funny and neat.
Reply With Quote
     
     
  #177  
Old Posted Feb 1, 2013, 12:22 AM
Chicago103's Avatar
Chicago103 Chicago103 is offline
Future Mayor of Chicago
 
Join Date: Mar 2003
Location: Chicago
Posts: 6,060
Quote:
Originally Posted by easy as pie View Post
also, chicago103: fantastic photo set, chicago looks great. as an aside, let me also mention that i really like these chicago/nyc posts of yours, the astonished updates and thoughts on how nyc could be so colossally grander than chicago are kind of funny and neat.
Well none of those pictures are mine, I hope I properly cited them. Most of the NYC pictures are from NYgirl photo threads on SSC and SSP and the recent Chicago ones are from a recent photo thread by Thundertubs in city photos.

As far as the second part it is not that I think NYC is more "colossally grander" than Chicago it is more amazement of how widespread density is in NYC. As someone who has always judged other big cities through Chicago eyes it is quite stunning to encounter a city that blows even us out of the water as far as population density. I guess the extreme population density of parts of NYC makes me a tiny bit envious but at the same time I am perfectly happy with what my city offers and outside of size and population density just about everything else in Chicago IMO is on par with or better than NYC but that is a bit off topic.
__________________
Devout Chicagoan, political moderate and paleo-urbanist.

"Auto-centric suburban sprawl is the devil physically manifesting himself in the built environment."
Reply With Quote
     
     
  #178  
Old Posted Feb 17, 2013, 9:47 PM
Chicago103's Avatar
Chicago103 Chicago103 is offline
Future Mayor of Chicago
 
Join Date: Mar 2003
Location: Chicago
Posts: 6,060
Found these posts in another thread that got a bit off topic and realized it would make more sense to discuss this here.

Quote:
Originally Posted by mhays View Post
How dense are the densest parts of those cities? Do mid-sized Midwest cities have census tracts (as imperfect as those are) in the 20,000 to 40,000 per square mile category? I'm just guessing, but Portland might top out in the 30s currently. This is an honest question...guessing there are some examples in that range and possibly higher.
Quote:
Originally Posted by Jelly Roll View Post
According to the 2010 census I got the following.

Census tract 56 has the highest density in Portland at 26,835 with no other Portland census tract over 20,000 but a couple in the 15,000-20,000 range. St. Louis has a couple in the 10,000-12,000 range. Cincinnati's most dense tract is 15,800. Detroit's highest I could find was in the 12,000 range. Milwaukee's is 27,544 with multiple in the 15,000-25,000 range. Seattle's densest is 51,128.

I am actually somewhat shocked these places don't have higher densities. I live in one of the Jersey suburbs of Philadelphia and the densest tract in my town is 8,733 which is above average compared to some of these cities. Many of the dense parts of the "suburban" towns around here are almost as high as the densest part of these cities. It looks like the density levels of Palo Alto is also around the same level as these cities. Not really sure what it means if anything but it could be something to look into.
Quote:
Originally Posted by novawolverine View Post
Some of these cities have 2/3 or less of their peak population, which wasn't all that long ago, and the built environment has the look and feel of a place that's denser than what's actually there. It's not just the bigger Rust Belt cities, but the mid and small sized ones as well. I don't think these places were ever quite as dense as the top tier or two of the most urban cities we have, but they were certainly more dense than they are now.
Quote:
Originally Posted by Jelly Roll View Post
True and that would make sense. South Philly which is probably 90% rowhouses and relatively intact ranges from 20,000-50,000 which I would guess is probably closer to the what the these cities densest part were at their peak.
Quote:
Originally Posted by Centropolis View Post
I counted at least 12 census tracts over 10,000 for st.louis, more than a couple, just sayin'
Quote:
Originally Posted by goat314 View Post
St. Louis is an interesting city. The most intact neighborhoods actually have smaller household sizes, while the battered neighborhoods have much larger household sizes, but are structurally less dense. I would go out on a limb and say St. Louis has the densest intact neighborhoods in the Midwest outside of Chicago. Minneapolis and Milwaukee have slightly higher population densities, but didn't suffer the same amount of urban decay and population. St. Louis was denser than present day Chicago in 1950 and was definitely considered a tier two city until the mid 70s. The look of St. Louis surprises many people when they visit the city. They say "I had no idea St. Louis was this urban".
I find it interesting that as much as Chicago is beneath NYC in population density in spite of them both being very urban the same is true of the difference in population density between Chicago and cities below it on the food chain. For instance people talk all the time about St. Louis, Minneapolis and Portland as being so urban and in many respects rightly so however all of these cities struggle to have many census tracts above 12K per square mile or in other words average Chicago density. My neighborhood of about 10K per square mile in Chicago is dominated by single family detached bungalows and seen as "suburbanesque" by people living in denser lakefront neighborhoods and yet my neighborhood would be quite dense by Portland or St. Louis standards. There are neighborhoods in Chicago dominated by low rise buildings (two flats and small apartment buildings) that are denser than the mid to highrise dominated Central West End in St. Louis. It might be as confounding to people from St. Louis as it is to me as a Chicagoan wondering how a mostly rowhouse neighborhood in Brooklyn can have 50K density.
__________________
Devout Chicagoan, political moderate and paleo-urbanist.

"Auto-centric suburban sprawl is the devil physically manifesting himself in the built environment."
Reply With Quote
     
     
  #179  
Old Posted Mar 29, 2014, 10:17 PM
memph memph is offline
Registered User
 
Join Date: Dec 2010
Posts: 1,854
Comparison of Chicago and Toronto in 1950 vs 2010.


(more here)
Reply With Quote
     
     
  #180  
Old Posted Mar 30, 2014, 3:45 AM
HomrQT's Avatar
HomrQT HomrQT is offline
All-American City Boy
 
Join Date: Dec 2009
Location: Hinsdale / Uptown, Chicago
Posts: 1,939
Quote:
Originally Posted by Chicago103 View Post
I should post some Chicago pictures as a comparison or maybe someone else can. The point is that even Chicago's densest non highrise residential neighborhoods don't look like that. There are alleys, gangways, treelawns, etc. Also in Chicago non-highrise residential buildings are typically three-four stories tall unlike the five-seven very common in New York City and unlike there very rarely in Chicago is there a block long row of identically scaled buildings. In Chicago there are more ecclectic mixes of buildings even on commercial streets like four plus ones, two or three stories of apartments above shops, a one or two story old worker's cottage, one story car repair shop, then four story building with residences above shop again, etc all on one block. Solid block long walls of townhouses or attached five story tenements are a NYC phenomenon not a Chicago one, something like Alta Vista Terrace (block of row houses) here is an exception. Don't get me wrong I love New York City architecture but going simply block by block there is usually more building scale diversity in Chicago, not saying one is better than the other just different. NYC is a city of walls of attached buildings and low-mid rise canyons, Chicago really isn't, we are more of a bungalow and two flat kind of city and that is another reason the density here is less than half of NYC's.
It's absolutely fascinating for me to hear someone breakdown the difference in density between Chicago and NYC at street level. Awesome input!

__________________
1. 9 DeKalb Ave - Brooklyn, NYC - SHoP Architects - Photo
2. American Radiator Building - New York City - Hood, Godley, and Fouilhoux - Photo
3. One Chicago Square - Chicago - HPA and Goettsch Partners - Photo
4. Chicago Board of Trade - Chicago - Holabird & Root - Photo
5. Cathedral of Learning - Pittsburgh - Charles Klauder - Photo
Reply With Quote
     
     
This discussion thread continues

Use the page links to the lower-right to go to the next page for additional posts
 
 
Reply

Go Back   SkyscraperPage Forum > Discussion Forums > City Discussions
Forum Jump


Thread Tools
Display Modes

Forum Jump


All times are GMT. The time now is 5:46 PM.

     
SkyscraperPage.com - Archive - Privacy Statement - Top

Powered by vBulletin® Version 3.8.7
Copyright ©2000 - 2024, vBulletin Solutions, Inc.