 Posted Feb 17, 2017, 7:13 PM
|
 |
Registered User
|
|
Join Date: Dec 2016
Location: San Francisco
Posts: 24,177
|
|
|
How SF compares with other big cities
Quote:
By Lizzie Johnson, San Francisco Chronicle Updated 4:53 pm, Thursday, February 16, 2017
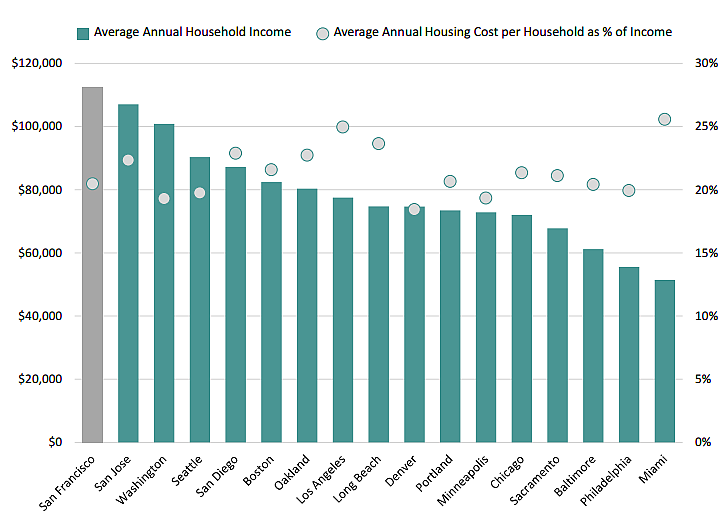
A thick stack of benchmark reports comparing San Francisco with other municipalities was released this week, and while much of the information confirms what residents already know, it’s interesting to see how the city stands out.
San Francisco has more rush hours per day than other cities. It also has the highest cost of living, population density and average household income, at $112,459, coupled with the lowest percentages of children and African American residents. San Franciscans love their libraries, logging an average eight visits each per year, and visiting their parks . . . .
New York City isn’t in the group because it’s too large to compare reasonably with San Francisco, a spokeswoman in the controller’s office said — they try to stick to apples-to-apples comparisons, a policy that excludes the Big Apple.
The findings come from data gathered in 2014 . . . .
The average speed of San Francisco’s buses is 8.1 miles per hour — the slowest among its peers. On average, residents hopped on public transportation 272 times, a number that is 65 times higher than other cities’ systems . . . .
The city uses 42 gallons of water per day, well below the 68 gallons per day average. San Francisco ranked No. 2 in air quality, with 301 good air days compared with San Mateo’s 332 — Los Angeles ranked last at 28 days.
San Francisco’s pavement-condition score was 68 out of 100 in an updated 2015 analysis, the second-highest among its peers behind Denver, which might chagrin San Francisco residents who complain about the city’s pothole-riddled streets . . . . Through voter approval of the street bonds in 2011, we have seen a steady improvement of the pavement condition. We’re going after the Rockies’ road score.”
. . . The city’s Recreation and Park Department spent more money per resident on services, at $213 per head, compared with $151 on average in the other cities. Residents also spent more time in the open spaces, with 33 visits per capita annually — more than double the 14 per-capita average . . . .
Residents also spent more time in libraries, with eight visits per capita, three more than the average. It ranked No. 2 in the category, only lagging behind Seattle . . . .
|
http://www.sfgate.com/bayarea/articl...s-10939013.php
The report is here: http://sfcontroller.org/sites/defaul...n%20Health.pdf
The cities to which SF is compared are :
Baltimore, MD
Boston, MA
Chicago, IL
Denver, CO
Long Beach, CA
Los Angeles, CA
Miami, FL
Minneapolis, MN
Oakland, CA
Philadelphia, PA
Portland, OR
Sacramento, CA
San Diego, CA
San Jose, CA
Seattle, WA
Washington, DC
__________________
Rusiya delenda est
|


 Linear Mode
