Hello Folks! I have decided to put my love of all things stats to use and make a thread for it...It will mainly be focused on NB and in particular Moncton, Fredericton and Saint John.
I am starting off with a few graphs but I will add more on a regular basis, so keep an eye out

I'll try to post my sources as best as possible (just click the link below the graph)...if you have any questions or corrections please let me know...I know the StatsCans website is very hard to navigate.
*Most Graphs are in Thousands* (65.5 = 65,500)
Population
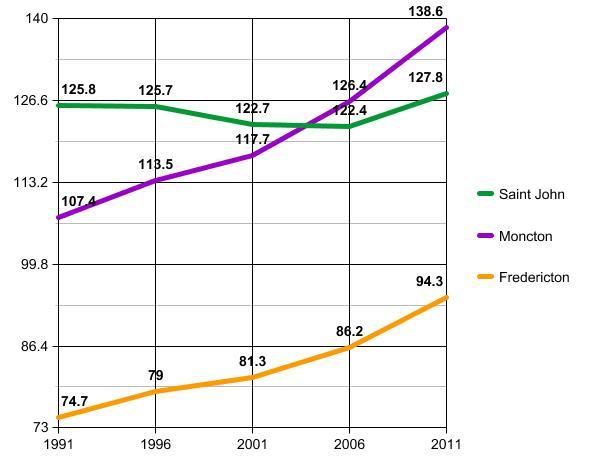
Census Subdivision (City)
 Source: StatsCan
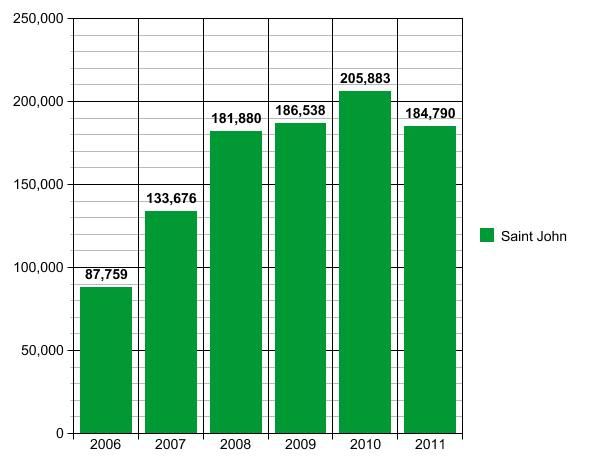
Census Metropolitan Area / Census Agglomeration (Metro)
Source: StatsCan
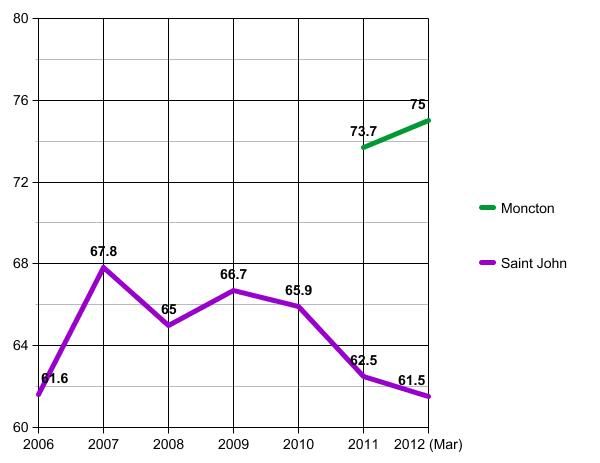
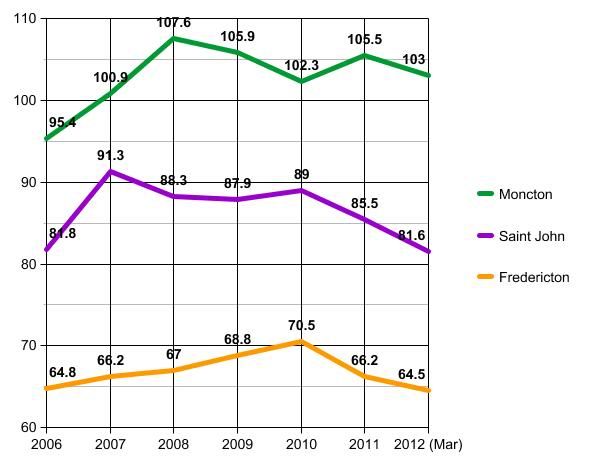
Census Metropolitan Area / Census Agglomeration (Metro)
Source:
StatsCan
Tourism
Hotel Nights Sold

Source:
NB Tourism Dept. (Tourism Indicators Summary Report),
NB Tourism Dept. (2012 Tourism Indicators)
Cruise Ship Passengers
Source:
NB Tourism Dept. (Tourism Indicators Summary Report)
Airport Passengers

Source: Each Airports Annual Reoprts
Employment
Employment (Metro) (Moncton was only added to this one in 2011) (I used the number from Dec. of each year, except 2012)
Source:
StatsCan (Tables : Table 5-1)
Employment (Economic Region) (I used the number from Dec. of each year, except 2012)
Source:
StatsCan (Tables : Table 6-1)
Housing
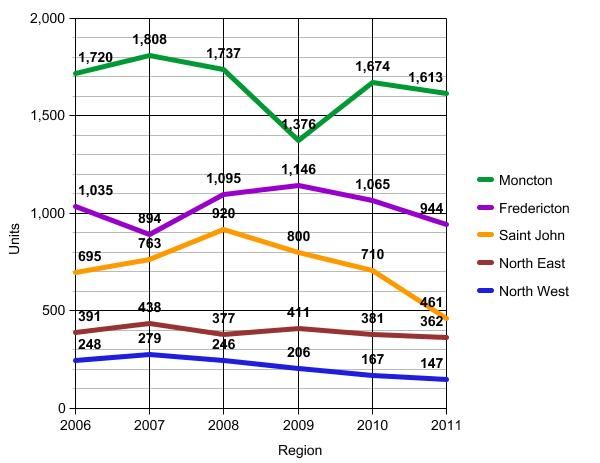
Housing Starts (Economic Region) 2006-2011 (total units, includes apartments, condo units, detached houses etc)
 Housing Starts (Economic Region) 2012
 (total units, includes apartments, condo units, detached houses etc)
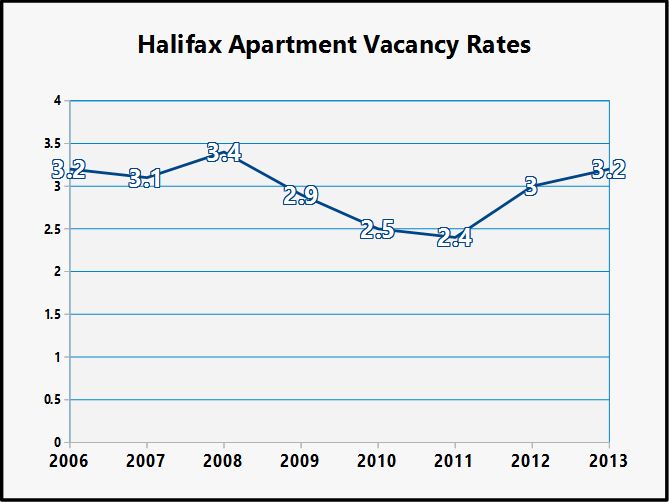
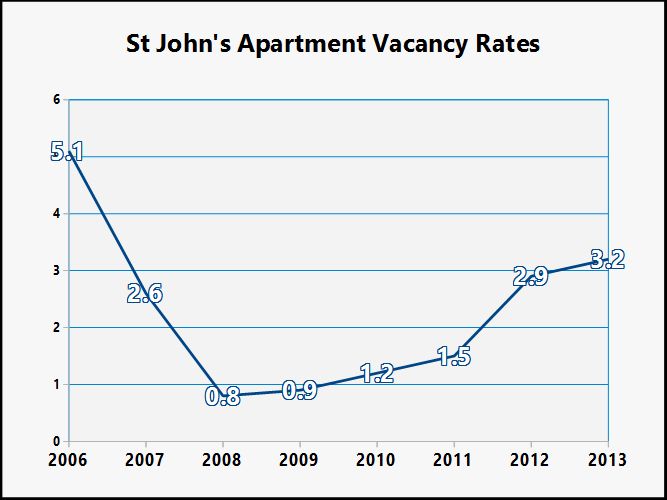
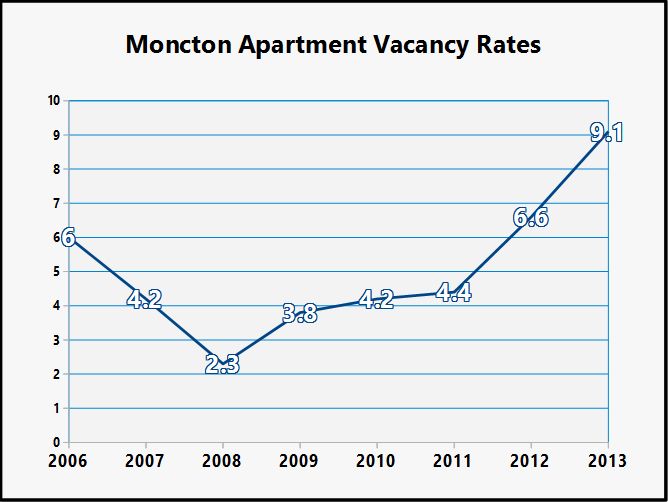
 CMA/CA Apartment Vacancy Rate
 (Buildings of 3 or more units)

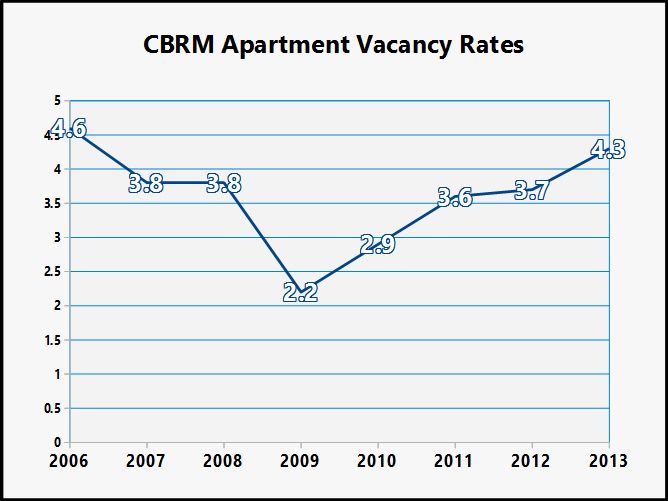
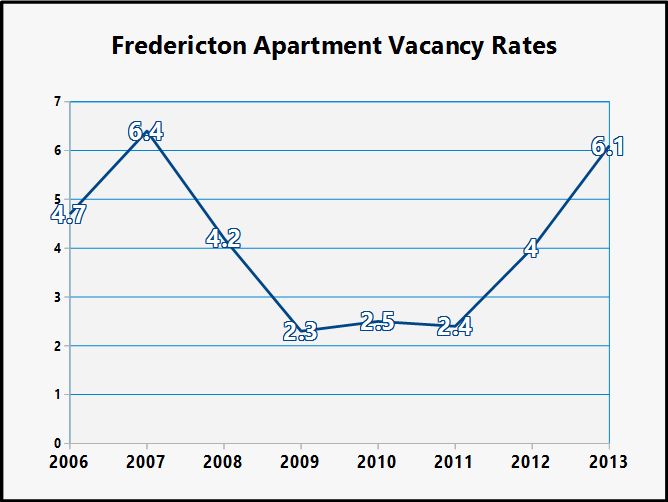
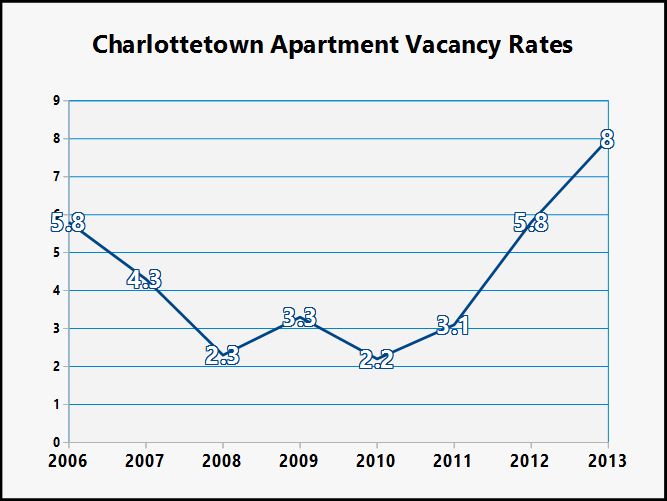
Sources:
Statscan
Retail
3 "Big Mall" Stats
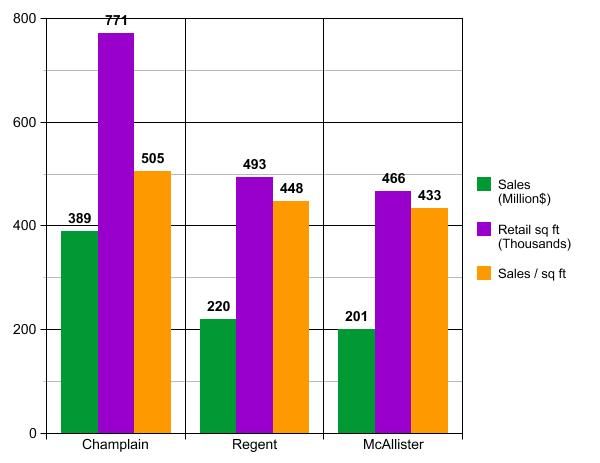
Source:
http://www.cfretail.com/EN/PropertyS...earchMaps.aspx
Construction
CMA Building Permit Values

Source:
Statscan


 Prev
Prev


 Hybrid Mode