...and now we are traveling to the other side of the Atlantic and to the United Kingdom!
First off a little about this very rich & influential country in a historical context, albeit short and I know that it doesn't do the UK justice to make it brief -- this is a decent opening to our demographic adventure.
This from: thecommonwealth.org
"Stone circles like Avebury and Stonehenge are evidence of prehistoric cultures, especially notable in the milder south of England where ancient sites abound. Julius Caesar led token Roman expeditions into Britain in 55 and 54 BCE. Roman colonisation began 80 years later, lasting from CE 43 to about 409. Scotland resisted occupation for most of the period.
After the departure of the Romans, Angles, Saxons and Jutes from northern Europe settled, the Angles giving their name to England. Several large kingdoms emerged: Northumbria in the north, Mercia in the midlands and Wessex in the south. Vikings from Scandinavia made incursions from the eighth century and settled widely in the north and east. Ireland was dominated by the Vikings during the tenth century. In 1066 England was invaded and conquered by the Norman duke William of Normandy (France).
In 1169 Henry II of England authorised an invasion of Ireland, following which a large part of the country came under the control of Anglo-Norman magnates. Wales came under English rule during the 13th century, during the reign of Edward I; but the continuing strength of Welsh national feeling was shown by a rising at the beginning of the 15th century.
Christianity spread in the sixth to seventh centuries. Much of Britain shifted from Roman Catholicism to Protestantism in the 16th century. England retained an Episcopalian church (governed by bishops), while Scotland embraced a Presbyterian system.
In 1603, King James VI of Scotland succeeded to the English throne, so uniting the two Crowns. However, England and Scotland remained separate political entities during that century, apart from an enforced period of unification under Oliver Cromwell in the 1650s. In 1707 both countries agreed on a single parliament for Great Britain.
Several campaigns were waged against Irish insurgents during the reign of Elizabeth I (1558–1603). The northern province of Ulster resisted English rule particularly strongly; following defeat of the rebels, Ulster was settled by immigrants from Scotland and England. Further risings were crushed by Oliver Cromwell. An uneasy peace prevailed throughout most of the 18th century. In 1782 the Irish Parliament was given legislative independence and in 1801 Ireland was joined to Great Britain by an Act of Union.
England has ousted its monarch on more than one occasion. During England’s civil wars (1642–51), triggered by clashes between king and parliament, Charles I was executed and a republic briefly instated under Oliver and later Richard Cromwell (1649–60). In 1688 a bloodless ‘revolution’ took place, and James II was replaced by William and Mary.
Britain transformed itself from an agrarian to an industrial society from the 1760s to 1830s, the world’s first industrial revolution. The country also developed a powerful navy and merchant fleet. It was the first nation to have a political anti-slavery movement, which led the government to ban the slave trade in 1807 and slavery in 1833–34.
In the 19th century, wealthy and industrialised, Britain became the major world power with an empire that included colonies on every continent. However, the 20th century reversed much of this. Two world wars, failure to keep pace with industrial advance, a severe brain drain and the independence of Commonwealth countries reduced Britain’s position on the world stage. But it remains a leading liberal democracy, with art and literature, intellectual freedoms and parliamentary traditions of lasting influence."
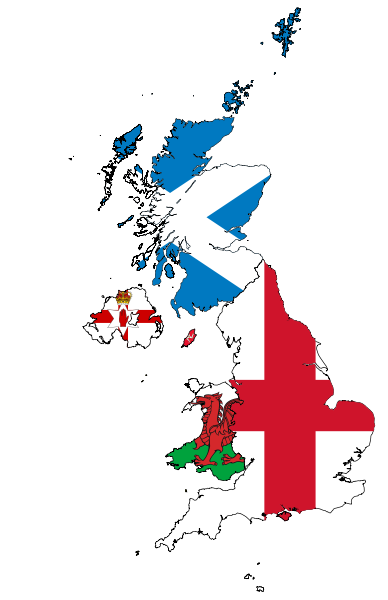
Image Source: wikimedia.org
Top 50 Non-United Kingdom countries or places of birth
United Kingdom 2011
1 India (Bhārat) 722,433
2 Poland (Polska) 654,010
3 Pakistan 502,796
4 Ireland, Republic of (Éire) 468,183
5 Germany (Deutschland) 299,746
6 Bangladesh 214,091
7 South Africa, Republic of 203,477
8 Nigeria 201,184
9 United States of America 197,355
10 China, People's Republic of 170,059
11 Jamaica 160,776
12 Italy (Italia) 141,205
13 Kenya 140,536
14 France 139,419
15 Philippines (Pilipinas), Republic of the 129,836
16 Sri Lanka 129,076
17 Australia 126,316
18 Zimbabwe 123,671
19 China, Hong Kong (Special Administrative Region) 111,733
20 Lithuania (Lietuva) 108,711
21 Somalia 103,049
22 Ghana 95,666
23 Turkey (Türkiye) 93,916
24 Portugal 92,065
25 Spain (España) 84,820
26 Iran, Islamic Republic of 84,735
27 Romania (România) 83,168
28 Canada 80,389
29 Cyprus 78,901
30 Iraq 75,295
31 Malaysia 69,939
32 Netherlands (Nederland) 63,713
33 Afghanistan, Islamic Republic of 63,496
34 Slovak Republic (Slovenská republika/Slovakia) 63,054
35 New Zealand (Aotearoa) 62,584
36 Latvia (Latvija) 61,441
37 Uganda 60,883
38 Hungary (Magyarország) 52,250
39 Brasil 52,148
40 Nepal 50,881
41 Bulgaria (Balgariya) 48,258
42 Thailand 44,086
43 Singapore 42,189
44 Mauritius (Maurice) 41,978
45 Russian Federation (Russia) 39,529
46 Czech Republic (Česká Republika) 38,705
47 Japan 37,331
48 Greece (Hellenic Republic) 36,933
49 Tanzania, United Republic of 35,994
50 Saudi Arabia 33,628
Total Foreign-born: 7,993,480
Total Population: 63,182,178
Source: Office for National Statistics (UK), Census 2011
In 2001, the UK had the largest population of people born in South Africa, Ireland, Kenya, Somalia, Zimbabwe, Australia, Cyprus, Montserrat, Saint Helena, Uganda & Tanzania outside of their region of origin (e.g., Africa, Asia/Middle East, etc.).
Main Language: All usual residents aged 3 and over (excluding English)
United Kingdom 2011
1 Polish 618,091
2 Panjabi (Punjabi) 296,469
3 Urdu 292,382
4 Bengali (with Sylheti and Chatgaya) 225,355
5 Gujarati 214,019
6 Chinese (other) 171,169
7 Arabic 168,980
8 French 162,572
9 Portuguese 138,921
10 Spanish 131,696
11 Tamil 103,488
12 Turkish 102,712
13 Italian 100,922
14 German 89,285
15 Lithuanian 88,975
16 Somali 87,023
17 Persian/Farsi 78,960
18 Tagalog/Filipino 75,616
19 Russian 74,558
20 Romanian 70,285
21 Scots 57,459
22 Slovak 54,923
23 Nepalese 54,102
24 Greek 53,092
25 Hindi 51,269
26 Kurdish 49,195
27 Hungarian 48,096
28 Cantonese Chinese 45,370
29 Pashto 41,234
30 Malayalam 40,757
31 Bulgarian 40,463
32 Latvian 35,334
33 Albanian 32,936
34 Czech 31,860
35 Dutch 30,668
36 Thai 29,712
37 Japanese 29,242
38 Gaelic (Scottish) 25,032
39 Shona 23,210
40 Mandarin Chinese 22,425
41 Pakistani Pahari (with Mirpuri and Potwari) 22,363
42 Swedish 21,145
43 Akan 19,229
44 Yoruba 17,354
45 Swahili/Kiswahili 16,658
46 Telugu 16,343
47 Korean 16,007
48 Vietnamese 15,478
49 Sinhala 15,223
50 Serbian/Croatian/Bosnian 14,853
...and now we are going to proceed to the Big Ben of the UK...

Image Source:
http://imaginary-visions.co.uk
Top 50 Non-United Kingdom countries or places of birth
Greater London, United Kingdom 2011 *
These stats are not of the Metro area as it was very difficult to compile something comprehensive.
1 India (Bhārat) 262,247
2 Poland (Polska) 158,300
3 Ireland, Republic of (Éire) 129,807
4 Nigeria 114,718
5 Pakistan 112,457
6 Bangladesh 109,948
7 Jamaica 87,467
8 Sri Lanka 84,542
9 France 66,654
10 Somalia 65,333
11 Kenya 64,212
12 United States of America 63,920
13 Ghana 62,896
14 Italy (Italia) 62,050
15 Turkey (Türkiye) 59,596
16 South Africa, Republic of 57,765
17 Germany (Deutschland) 55,476
18 Australia 53,959
19 Romania (România) 44,848
20 Philippines (Pilipinas), Republic of the 44,199
21 Cyprus 43,428
22 Portugal 41,041
23 Lithuania (Lietuva) 39,817
24 China, People's Republic of 39,452
25 Afghanistan, Islamic Republic of 37,680
26 Iran, Islamic Republic of 37,339
27 Spain (España) 35,880
28 Uganda 32,136
29 Brasil 31,357
30 Iraq 29,789
31 New Zealand (Aotearoa) 28,547
32 Bulgaria (Balgariya) 27,207
33 China, Hong Kong (Special Administrative Region) 26,435
34 Mauritius (Maurice) 23,779
35 Kosovo (Kosova) 21,516
36 Zimbabwe 21,309
37 Canada 21,288
38 Malaysia 21,209
39 Japan 20,637
40 Colombia 19,338
41 Nepal 19,051
42 Netherlands (Nederland) 18,252
43 Hungary (Magyarország) 17,803
44 Sierra Leone 17,245
45 Russian Federation (Russia) 16,757
46 Tanzania, United Republic of 16,156
47 Greece (Hellenic Republic) 15,907
48 Algeria (Al Jaza'ir) 15,829
49 Vietnam (Việt Nam), Socialist Republic of 15,337
50 Sweden 14,747
Total Foreign-born: 2,998,264
Total Population: 8,173,941

Image Source: wikimedia.org
Top 50 Non-United Kingdom countries or places of birth
Greater London BUA, United Kingdom 2011
1 India (Bhārat) 285,043
2 Poland (Polska) 174,893
3 Ireland, Republic of (Éire) 148,974
4 Pakistan 123,488
5 Nigeria 119,955
6 Bangladesh 111,661
7 Jamaica 88,817
8 Sri Lanka 88,418
9 South Africa, Republic of 73,994
10 United States of America 72,360
11 France 70,992
12 Kenya 70,284
13 Italy (Italia) 69,061
14 Germany (Deutschland) 65,907
15 Somalia 65,066
16 Ghana 64,993
17 Turkey (Türkiye) 61,484
18 Australia 58,902
19 Philippines (Pilipinas), Republic of the 49,736
20 Romania (România) 47,390
Foreign-born: 3,250,382
Built Up Area Population: 10,228,469
*Limited data, Top 20 only; another figure has the BUA at 9,787,426 but I chose the larger since it's as close as I could find to a metro population.
In 2001, London had the largest population of people born in South Africa, Ireland, Nigeria, Bangladesh, Kenya, Pakistan, Ghana, Somalia, Cyprus, South Africa, Australia, Mauritius, Montserrat, Saint Helena, Tanzania & Uganda of any other urban area outside of the region of origin (e.g., Africa, Asia/Middle East, etc.). It also has one of the largest US-born populations of any urban area outside of the US & Mexico (even more than Toronto a bit closer to home in Canada).
 Main Language: All usual residents aged 3 and over (excluding English)
Greater London, United Kingdom 2011
Main Language: All usual residents aged 3 and over (excluding English)
Greater London, United Kingdom 2011
1 Polish 147,816
2 Bengali (with Sylheti and Chatgaya) 114,267
3 Gujarati 101,676
4 French 84,191
5 Urdu 78,667
6 Portuguese 71,525
7 Turkish 71,242
8 Spanish 71,192
9 Arabic 70,602
10 Tamil 70,565
11 Panjabi 68,525
12 Somali 54,852
13 Italian 49,484
14 Romanian 39,653
15 Persian/Farsi 39,645
16 Lithuanian 35,341
17 Chinese (other) 34,712
18 German 31,306
19 Greek 26,924
20 Russian 26,603
21 Tagalog/Filipino 25,869
22 Bulgarian 23,032
23 Albanian 23,006
24 Hindi 21,503
25 Nepalese 19,388
26 Japanese 17,050
27 Hungarian 16,570
28 Kurdish 15,230
29 Pashto 15,096
30 Akan 13,188
31 Cantonese Chinese 12,329
32 Slovak 10,446
33 Swedish 10,428
34 Yoruba 10,119
35 Dutch 9,603
36 Malayalam 9,201
37 Korean 8,257
38 Vietnamese 8,087
39 Sinhala 7,945
40 Tigrinya 7,207
41 Serbian/Croatian/Bosnian 7,012
42 Thai 6,859
43 Czech 6,776
44 Mandarin Chinese 6,718
45 Swahili/Kiswahili 6,338
46 Amharic 6,174
47 Telugu 5,568
48 Igbo 5,252
49 Latvian 4,452
50 Hebrew 4,403
Main Language: All usual residents aged 3 and over (excluding English)
Greater London BUA, United Kingdom 2011
1 Polish 161,725
2 Bengali (with Sylheti and Chatgaya) 117,793
3 Gujarati 105,435
4 French 88,160
5 Urdu 83,950
6 Portuguese 75,905
7 Spanish 75,058
8 Panjabi 74,520
9 Turkish 73,716
10 Tamil 73,652
11 Arabic 73,641
12 Somali 54,886
13 Italian 54,220
14 Romanian 42,042
15 Persian/Farsi 41,204
16 Chinese (other) 38,570
17 Lithuanian 37,663
18 German 33,870
19 Russian 29,085
20 Tagalog/Filipino 29,055
21 Greek 28,544
22 Bulgarian 24,110
23 Albanian 23,636
24 Hindi 23,054
25 Nepalese 20,886
26 Hungarian 18,744
27 Japanese 17,851
28 Kurdish 15,631
29 Pashto 15,469
30 Akan 13,850
31 Cantonese Chinese 13,779
32 Slovak 12,713
33 Swedish 11,122
34 Dutch 10,886
35 Yoruba 10,440
36 Malayalam 10,263
37 Korean 9,498
38 Sinhala 8,730
39 Vietnamese 8,403
40 Thai 7,944
41 Czech 7,754
42 Serbian/Croatian/Bosnian 7,552
43 Mandarin Chinese 7,261
44 Tigrinya 7,222
45 Swahili/Kiswahili 6,537
46 Amharic 6,225
47 Telugu 6,006
48 Igbo 5,454
49 Afrikaans 5,085
50 Latvian 4,957
In 2001, London had the largest population of speakers of Bengali, Gujarati, Urdu & Somali outside of their region of origin (e.g., Africa, Asia/Middle East, etc.).
and off we go to Manchester (United)


Image Source: marketingmanchester.com
Top 50 Non-United Kingdom countries or places of birth
Greater Manchester (Met County), United Kingdom 2011
1 Pakistan 56,094
2 Ireland, Republic of (Éire) 26,433
3 India (Bhārat) 24,430
4 Poland (Polska) 22,733
5 Bangladesh 14,846
6 China, People's Republic of 10,897
7 Nigeria 10,236
8 Germany (Deutschland) 8,184
9 Iran, Islamic Republic of 6,302
10 Jamaica 5,884
11 Iraq 5,622
12 Zimbabwe 5,490
13 China, Hong Kong (Special Administrative Region) 4,915
14 Somalia 4,707
15 Kenya 4,080
16 South Africa, Republic of 3,949
17 United States of America 3,669
18 Italy (Italia) 3,603
19 Afghanistan, Islamic Republic of 2,868
20 Philippines (Pilipinas), Republic of the 2,862
21 France 2,851
22 Spain (España) 2,649
23 Malaysia 2,554
24 Australia 2,545
25 Czech Republic (Česká Republika) 2,432
26 Netherlands (Nederland) 2,401
27 Lithuania (Lietuva) 2,249
28 Saudi Arabia 2,243
29 Cyprus 2,239
30 Slovak Republic (Slovenská republika/Slovakia) 2,229
31 Ghana 2,149
32 Libyan Arab Jamahiriya (Libya) 2,094
33 Portugal 2,002
34 Canada 1,930
35 Congo (Zaire), Democratic Republic of the 1,797
36 Thailand 1,581
37 Romania (România) 1,546
38 Hungary (Magyarország) 1,544
39 Turkey (Türkiye) 1,539
40 Uganda 1,472
41 Sri Lanka 1,444
42 Latvia (Latvija) 1,442
43 Vietnam (Việt Nam), Socialist Republic of 1,438
44 Israel (Yisra'el) 1,409
45 Zambia 1,224
46 Greece (Hellenic Republic) 1,216
47 Angola 1,137
48 Bulgaria (Balgariya) 1,040
49 Eritrea (Ertra) 1,023
50 Egypt, Arab Republic of 1,011
Total Foreign-born: 323,185
Total Population: 2,682,528
Main Language: All usual residents aged 3 and over (excluding English)
Greater Manchester BUA, United Kingdom 2011
1 Urdu 31,642
2 Polish 20,618
3 Bengali (with Sylheti and Chatgaya) 16,973
4 Panjabi 16,156
5 Gujarati 11,568
6 Arabic 10,777
7 Chinese (other) 9,473
8 Persian/Farsi 5,579
9 French 4,910
10 Somali 3,862
11 Portuguese 3,590
12 Kurdish 3,529
13 Cantonese Chinese 3,411
14 Spanish 3,277
15 Pashto 2,681
16 Italian 2,300
17 Greek 2,196
18 German 2,110
19 Czech 2,089
20 Pakistani Pahari (with Mirpuri and Potwari) 1,989
21 Malayalam 1,809
22 Slovak 1,806
23 Russian 1,725
24 Tagalog/Filipino 1,577
25 Lithuanian 1,542
26 Mandarin Chinese 1,445
27 Hindi 1,412
28 Turkish 1,349
29 Hungarian 1,308
30 Romanian 1,267
31 Thai 1,119
32 Shona 1,107
33 Swahili/Kiswahili 1,042
34 Tamil 962
35 Dutch 924
36 Malay 882
37 Bulgarian 874
38 Tigrinya 853
39 Yoruba 823
40 Vietnamese 770
41 Latvian 699
42 Telugu 587
43 Albanian 557
44 Welsh/Cymraeg (in England only) 538
45 Korean 525
46 Yiddish 476
47 Japanese 463
48 Ukrainian 448
49 Akan 413
50 Swedish 410
Now we hop on over to the original Birmingham (sorry Alabama)!

Image Source: carmelite.org
Top 50 Non-United Kingdom countries or places of birth
Birmingham (BUA), United Kingdom 2011
1 Pakistan 73,680
2 India (Bhārat) 69,768
3 Jamaica 25,224
4 Ireland, Republic of (Éire) 23,346
5 Poland (Polska) 20,708
6 Bangladesh 19,071
7 Somalia 8,517
8 China, People's Republic of 7,803
9 Zimbabwe 7,177
10 Kenya 6,757
11 Germany (Deutschland) 5,768
12 Nigeria 5,219
13 Iraq 5,172
14 Afghanistan, Islamic Republic of 4,931
15 Yemen (Al Yaman) 4,202
16 Iran, Islamic Republic of 4,173
17 Philippines (Pilipinas), Republic of the 3,808
18 China, Hong Kong (Special Administrative Region) 3,580
19 Netherlands (Nederland) 3,464
20 South Africa, Republic of 2,835
21 United States of America 2,371
22 Latvia (Latvija) 2,365
23 Lithuania (Lietuva) 2,362
24 Italy (Italia) 2,344
25 Uganda 2,262
26 France 2,261
27 Slovak Republic (Slovenská republika/Slovakia) 2,143
28 Malaysia 1,977
29 Romania (România) 1,955
30 Sri Lanka 1,881
31 Tanzania, United Republic of 1,881
32 Vietnam (Việt Nam), Socialist Republic of 1,854
33 Ghana 1,739
34 Cyprus 1,688
35 Saint Kitts and Nevis 1,630
36 Eritrea (Ertra) 1,560
37 Congo (Zaire), Democratic Republic of the 1,342
38 Czech Republic (Česká Republika) 1,338
39 Australia 1,329
40 Canada 1,290
41 Sudan 1,218
42 Spain (España) 1,176
43 Denmark (Danmark) 1,122
44 Sweden 1,102
45 Montserrat 1,090
46 Barbados 1,080
47 Thailand 1,068
48 Saudi Arabia 1,064
49 Gambia, The 1,055
50 Portugal 1,024
Total Foreign-born: 386,649
Built Up Area Population (West Midlands): 2,419,500
Main Language: All usual residents aged 3 and over (excluding English)
Greater Birmingham (West Midlands) BUA, United Kingdom 2011
1 Panjabi 52,271
2 Urdu 40,049
3 Bengali (with Sylheti and Chatgaya) 20,287
4 Polish 19,725
5 Pakistani Pahari (with Mirpuri and Potwari) 13,111
6 Gujarati 9,373
7 Arabic 8,846
8 Somali 8,742
9 Chinese (other) 7,176
10 Pashto 6,982
11 Kurdish 5,078
12 Persian/Farsi 4,587
13 French 3,900
14 Hindi 2,672
15 Shona 2,147
16 Cantonese Chinese 2,062
17 Tagalog/Filipino 2,056
18 Lithuanian 2,008
19 Slovak 1,997
20 Russian 1,893
21 Tamil 1,862
22 Portuguese 1,739
23 Romanian 1,622
24 German 1,468
25 Spanish 1,424
26 Greek 1,385
27 Italian 1,384
28 Latvian 1,372
29 Mandarin Chinese 1,200
30 Malayalam 1,182
31 Tigrinya 1,172
32 Czech 1,169
33 Vietnamese 1,126
34 Dutch 822
35 Hungarian 781
36 Turkish 735
37 Thai 732
38 Bulgarian 694
39 Albanian 687
40 Telugu 633
41 Nepalese 587
42 Swahili/Kiswahili 535
43 Serbian/Croatian/Bosnian 507
44 Korean 471
45 Malay 443
46 Amharic 368
47 Yoruba 355
48 Sinhala 340
49 Swedish 307
50 Akan 302
Moving along to...

Image Source: wikimedia.org
Top 30 Non-United Kingdom countries or places of birth
Leeds, United Kingdom 2011
1 Pakistan 8,712
2 India (Bhārat) 8,284
3 Poland (Polska) 7,139
4 Ireland, Republic of (Éire) 4,762
5 Zimbabwe 3,205
6 Germany (Deutschland) 2,816
7 China, People's Republic of 2,543
8 Iraq 2,039
9 Iran, Islamic Republic of 1,744
10 Nigeria 1,744
11 Bangladesh 1,729
12 Jamaica 1,332
13 Kenya 1,281
14 United States of America 1,241
15 South Africa, Republic of 1,222
16 Philippines (Pilipinas), Republic of the 1,220
17 Saudi Arabia 1,213
18 China, Hong Kong (Special Administrative Region) 1,188
19 Italy (Italia) 1,063
20 Eritrea (Ertra) 1,057
21 Afghanistan, Islamic Republic of 1,044
22 Lithuania (Lietuva) 1,032
23 Ghana 995
24 Malaysia 955
25 France 897
26 Australia 881
27 Saint Kitts and Nevis 781
28 Czech Republic (Česká Republika) 773
29 Somalia 743
30 Spain (España) 695
Total Foreign-born: 86,144
Total Population: 751,485
Main Language: All usual residents aged 3 and over (excluding English)
Leeds, United Kingdom 2011
1 Polish 6,717
2 Urdu 4,989
3 Punjabi 4,537
4 Arabic 3,393
5 Chinese (other) 2,337
6 Bengali (with Sylheti and Chatgaya) 1,955
7 Kurdish 1,772
8 French 1,724
9 Persian/Farsi 1,623
10 Portuguese 1,260
11 Tigrinya 904
12 Spanish 851
13 Lithuanian 842
14 Shona 793
15 Gujarati 760
16 Russian 737
17 Greek 726
18 Czech 707
19 Hindi 705
20 Cantonese Chinese 704
21 Italian 690
22 Tagalog/Filipino 682
23 German 681
24 Pashto 646
25 Somali 593
26 Slovak 558
27 Pakistani Pahari (with Mirpuri and Potwari) 529
28 Mandarin Chinese 458
29 Malay 398
30 Thai 372
...and our last stop in the UK for tonight the city of...

Image Source: wikimedia.org
Top 30 Non-United Kingdom countries or places of birth
Sheffield, United Kingdom 2011
1 Pakistan 8,703
2 China, People's Republic of 4,798
3 India (Bhārat) 3,990
4 Poland (Polska) 2,764
5 Yemen (Al Yaman) 2,562
6 Somalia 2,372
7 Ireland, Republic of (Éire) 1,879
8 Germany (Deutschland) 1,812
9 Jamaica 1,775
10 Zimbabwe 1,652
11 Nigeria 1,417
12 Slovak Republic (Slovenská republika/Slovakia) 1,414
13 Bangladesh 1,403
14 Iraq 1,316
15 Iran, Islamic Republic of 1,255
16 Malaysia 1,116
17 United States of America 957
18 China, Hong Kong (Special Administrative Region) 830
19 Saudi Arabia 797
20 South Africa, Republic of 759
21 Libyan Arab Jamahiriya (Libya) 742
22 France 657
23 Turkey (Türkiye) 606
24 Italy (Italia) 570
25 Eritrea (Ertra) 565
26 Kenya 561
27 Ghana 550
28 Australia 535
29 Zambia 508
30 Canada 473
Total Foreign-born: 64,522
Total Population: 552,698
Main Language: All usual residents aged 3 and over (excluding English)
Sheffield, United Kingdom 2011
1 Arabic 5,509
2 Urdu 5,399
3 Chinese (other) 4,546
4 Panjabi 3,841
5 Polish 3,257
6 Somali 2,080
7 Slovak 2,028
8 Bengali (with Sylheti and Chatgaya) 1,541
9 Persian/Farsi 1,203
10 Kurdish 1,151
11 French 1,084
12 Pashto 949
13 Spanish 850
14 Mandarin Chinese 656
15 Pakistani Pahari (with Mirpuri and Potwari) 624
16 Turkish 618
17 Russian 612
18 Czech 611
19 Shona 578
20 Cantonese Chinese 567
21 Lithuanian 547
22 Portuguese 541
23 German 514
24 Greek 506
25 Malay 492
26 Tigrinya 450
27 Hindi 448
28 Italian 394
29 Tamil 371
30 Telugu 348
*Built Up Area, slightly larger area than Leed statistics posted above
Stay tuned for more...we've got at least 10 more to go in the UK (England, Scotland, Wales) before we head through the Channel Tunnel and down to France!


 Prev
Prev


 Since this thread will be ongoing i'll be revisiting TO & probably compile one that includes Oshawa, Burlington & perhaps Hamilton.


 Linear Mode
