Without further ado we now head over to France!
First, here is a little history about France -- this from Wikipedia:
"The first written records for the history of France appeared in the Iron Age. What is now France made up the bulk of the region known to the Romans as Gaul. Roman writers noted the presence of three main ethno-linguistic groups in the area: the Gauls, the Aquitani, and the Belgae. The Gauls, the largest and best attested group, were Celtic people speaking what is known as the Gaulish language.
Over the course of the 1st millennium BC the Greeks, Romans and Carthaginians established colonies on the Mediterranean coast and the offshore islands. The Roman Republic annexed southern Gaul as the province of Gallia Narbonensis in the late 2nd century BC, and Roman forces under Julius Caesar conquered the rest of Gaul in the Gallic Wars of 58–51 BC. Afterwards a Gallo-Roman culture emerged and Gaul was increasingly integrated into the Roman Empire.
In the later stages of the Roman Empire, Gaul was subject to barbarian raids and migration, most importantly by the Germanic Franks. The Frankish king Clovis I united most of Gaul under his rule in the late 5th century, setting the stage for Frankish dominance in the region for hundreds of years. Frankish power reached its fullest extent under Charlemagne. The medieval Kingdom of France emerged from the western part of Charlemagne's Carolingian Empire, known as West Francia, and achieved increasing prominence under the rule of the House of Capet, founded by Hugh Capet in 987.
A succession crisis following the death of the last direct Capetian monarch in 1328 led to the series of conflicts known as the Hundred Years' War between the House of Valois and the House of Plantagenet. The war formally began in 1337 following Philip VI's attempt to seize the Duchy of Aquitaine from its hereditary holder, Edward III of England, the Plantagenet claimant to the French throne. Despite early Plantagenet victories, including the capture and ransom of John II of France, fortunes turned in favor of the Valois later in the war. Among the notable figures of the war was Joan of Arc, a French peasant girl who led French forces against the English, establishing herself as a national heroine. The war ended with a Valois victory in 1453.
Victory in the Hundred Years' War had the effect of strengthening French nationalism and vastly increasing the power and reach of the French monarchy. During the period known as the Ancien Régime, France transformed into a centralized absolute monarchy. During the next centuries, France experienced the Renaissance and the Protestant Reformation. At the height of the French Wars of Religion, France became embroiled in another succession crisis, as the last Valois king, Henry III, fought against rival factions the House of Bourbon and the House of Guise. Henry, King of Navarre, scion of the Bourbon family, would be victorious in the conflict and establish the French Bourbon dynasty. A burgeoning worldwide colonial empire was established in the 16th century. French political power reached a zenith under the rule of Louis XIV, "The Sun King", builder of Versailles Palace.
In the late 18th century the monarchy and associated institutions were overthrown in the French Revolution. The country was governed for a period as a Republic, until the French Empire was declared by Napoleon Bonaparte. Following Napoleon's defeat in the Napoleonic Wars, France went through several further regime changes, being ruled as a monarchy, then briefly as a Second Republic, and then as a Second Empire, until a more lasting French Third Republic was established in 1870. "
and a little about the more modern day France -- this excerpt from bonjourlafrance.com
"France is a global centre of art, science, and philosophy. It hosts Europe's fourth-largest number of cultural UNESCO World Heritage Sites and receives around 83 million foreign tourists annually, the most of any country in the world.
France is a developed country with the world’s sixth-largest economy by nominal GDP and ninth-largest by purchasing power parity. In terms of aggregate household wealth, it ranks fourth in the world. France performs well in international rankings of education, health care, life expectancy, and human development.
The French Republic is a transcontinental country comprising territory in western Europe and several overseas regions and territories. The European, or metropolitan, area of France extends from the Mediterranean Sea to the English Channel and the North Sea, and from the Rhine to the Atlantic Ocean.
Overseas France include French Guiana on the South American continent and several island territories in the Atlantic, Pacific and Indian oceans.
France spans 643,801 square kilometres (248,573 sq mi) and has a total population of 66.7 million. The capital in Paris, the country’s largest city and main cultural and commercial centre.
France remains a great power in the world, being a founding member of the United Nations, where it serves as one of the five permanent members of the UN Security Council, and a founding and leading member state of the European Union (EU). It is also a member of the Group of 7, North Atlantic Treaty Organization (NATO), Organisation for Economic Co-operation and Development (OECD), the World Trade Organization (WTO), and La Francophonie."


Image Sources: wikimedia.org
Top 40 Non-France countries or places of birth
France 2015
1 Algeria (Al Jaza'ir) 790,158
2 Morocco (Al Maghrib) 740,552
3 Portugal 621,328
4 Italy (Italia) 285,814
5 Tunisian Republic (Tunisia) 269,613
6 Turkey (Türkiye) 249,079
7 Spain (España) 248,268
8 United Kingdom 147,971
9 Germany (Deutschland) 117,464
10 Belgium, Kingdom of 115,503
11 Romania (România) 110,919
12 China, People's Republic of 102,280
13 Sénégal 96,444
14 Poland (Polska) 91,481
15 Côte d'Ivoire 83,038
16 Cameroon 79,338
17 Congo (Zaire), Democratic Republic of the 77,670
18 Serbia (Srbija) 76,431
19 Vietnam (Việt Nam), Socialist Republic of 75,230
20 Mali 71,591
21 Russian Federation (Russia) 66,544
22 Congo, Republic of the 64,433
23 Switzerland (Swiss Confederation) 58,694
24 Madagascar (Madagasikara) 54,958
25 Cambodia (Kampuchea) 50,590
26 Haïti 48,727
27 Sri Lanka 48,354
28 India (Bhārat) 37,582
29 Brasil 36,859
30 United States of America 36,830
31 Lebanese Republic (Lebanon) 35,935
32 Netherlands (Nederland) 35,697
33 Guinea (Guinée) 33,736
34 Comoros (Komori) 33,172
35 Mauritius (Maurice) 32,395
36 Colombia 26,208
37 Pakistan 24,275
38 Angola 20,425
39 Japan 18,461
40 Mauritania, Islamic Republic of 16,478
Total Foreign-born (excludes Territories, Departments, etc.): 5,982,300
Total Population: 64,300,821
Source: INSEE (France)
France by far has the largest population of people born in Algeria, Morocco, Portugal, Tunisia, neighboring Belgium & Spain, former French colonies and possessions of Africa like Bénin, Cameroon, Comoros, Congo, Madagascar, Côte d'Ivoire, Sénégal (among others) in the World outside of their region of origin to the largest population of people born in Cambodia, Laos & Vietnam in Europe.
That being said -- as just mentioned above, the largest city of France -- Paris, also holds many of the same titles (in regards to metro areas).
...speaking of which here is...."The City of Light (La Ville Lumière)."
*The following information is of the most current statistics followed by another that included French Overseas Departments.
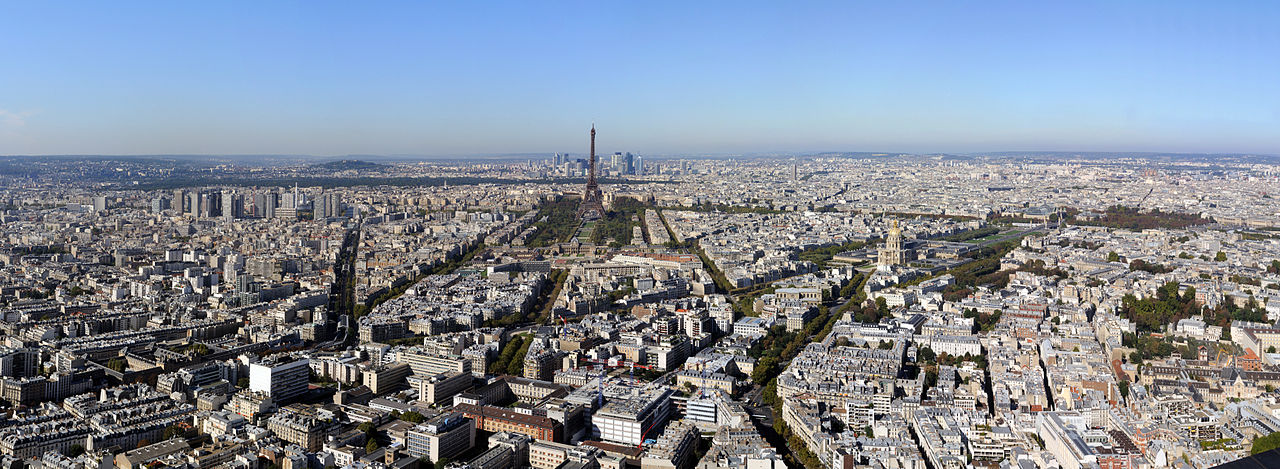
Image Source: wikimedia.org
Top 30 Non-France countries or places of birth
Paris (Île-de-France), France 2015
1 Algeria (Al Jaza'ir) 311,964
2 Portugal 249,776
3 Morocco (Al Maghrib) 244,153
4 Tunisian Republic (Tunisia) 117,760
5 Turkey (Türkiye) 70,222
6 China, People's Republic of 67,747
7 Mali 60,943
8 Italy (Italia) 57,700
9 Côte d'Ivoire 55,334
10 Sénégal 53,123
11 Romania (România) 49,470
12 Spain (España) 48,221
13 Congo (Zaire), Democratic Republic of the 47,474
14 Cameroon 42,105
15 Sri Lanka 42,095
16 Poland (Polska) 39,285
17 Congo, Republic of the 36,701
18 Haïti 36,128
19 Vietnam (Việt Nam), Socialist Republic of 35,420
20 Cambodia (Kampuchea) 31,416
21 India (Bhārat) 26,650
22 Serbia (Srbija) 26,429
23 Germany (Deutschland) 22,063
24 Lebanese Republic (Lebanon) 20,500
25 Mauritius (Maurice) 19,789
26 Madagascar (Madagasikara) 19,596
27 Pakistan 18,843
28 United Kingdom 18,726
29 Russian Federation (Russia) 18,260
30 United States of America 17,722
Total Foreign-born (excludes Territories, Departments, etc.): 2,321,343
Metropolitan Area Population: 12,532,901

Image Source: wikimedia.org
Top 30 Non-France countries or places of birth *Includes overseas France in Top 30 but they're not included in Total Foreign-born.
Paris (Île-de-France), France 2012
1 Algeria (Al Jaza'ir) 289,826
2 Portugal 241,385
3 Morocco (Al Maghrib) 227,903
4 Tunisian Republic (Tunisia) 109,349
5 Guadeloupe (Overseas France) 80,402
6 Martinique (Overseas France) 76,586
7 Turkey (Türkiye) 69,338
8 China, People's Republic of 61,806
9 Mali 55,466
10 Italy (Italia) 55,057
11 Côte d'Ivoire 48,532
12 Sénégal 46,365
13 Spain (España) 46,359
14 Congo (Zaire), Democratic Republic of the 42,872
15 Poland (Polska) 39,482
16 Romania (România) 38,865
17 Cameroon 38,093
18 Sri Lanka 36,918
19 Vietnam (Việt Nam), Socialist Republic of 36,084
20 Haïti 33,417
21 Congo, Republic of the 33,223
22 Cambodia (Kampuchea) 32,120
23 Réunion (Overseas France) 30,341
24 Serbia (Srbija) 27,317
25 India (Bhārat) 24,318
26 Germany (Deutschland) 22,880
27 Mauritius (Maurice) 19,903
28 Lebanese Republic (Lebanon) 19,616
29 United Kingdom 19,029
30 Madagascar (Madagasikara) 18,504
Total Foreign-born (excludes Territories, Departments, etc.): 2,160,561
Metropolitan Area Population: 12,341,418
Southward we go to..
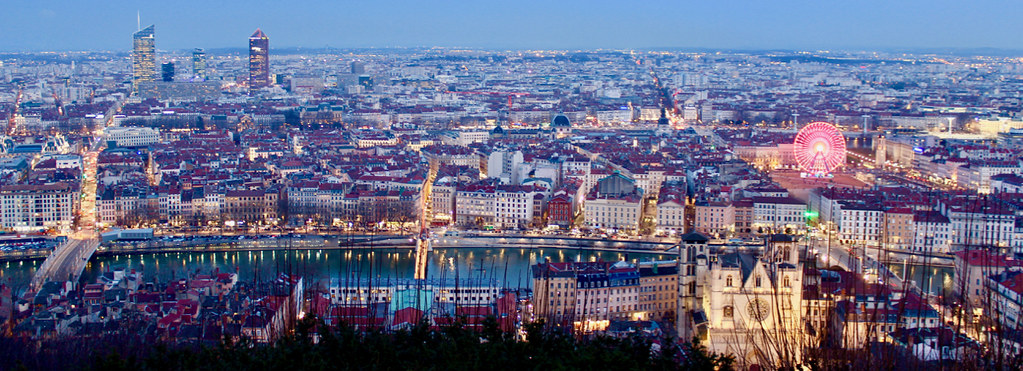
Image Source:
subherwal@flickr.com
Top 30 Non-France countries or places of birth
Lyon, France 2015
1 Algeria (Al Jaza'ir) 55,553
2 Portugal 23,388
3 Tunisian Republic (Tunisia) 21,886
4 Morocco (Al Maghrib) 18,947
5 Italy (Italia) 15,729
6 Turkey (Türkiye) 12,751
7 Spain (España) 10,147
8 Serbia (Srbija) 4,345
9 Vietnam (Việt Nam), Socialist Republic of 3,805
10 Congo (Zaire), Democratic Republic of the 3,559
11 Cameroon 3,435
12 Romania (România) 3,135
13 Sénégal 3,046
14 China, People's Republic of 2,943
15 Germany (Deutschland) 2,576
16 Cambodia (Kampuchea) 2,513
17 Poland (Polska) 2,467
18 Russian Federation (Russia) 2,465
19 United Kingdom 2,211
20 Congo, Republic of the 2,121
21 Belgium, Kingdom of 2,081
22 Côte d'Ivoire 2,079
23 Comoros (Komori) 2,031
24 Angola 1,644
25 Madagascar (Madagasikara) 1,617
26 Brasil 1,542
27 Lebanese Republic (Lebanon) 1,540
28 Guinea (Guinée) 1,405
29 Colombia 1,280
30 United States of America 1,229
Total Foreign-born (excludes Territories, Departments, etc.): 253,712
Urban Area Population: 2,291,763
...and down to the Mediterranean Sea...

Image Source: wikimedia.org
Top 30 Non-France countries or places of birth
Marseille, France 2015
1 Algeria (Al Jaza'ir) 56,755
2 Tunisian Republic (Tunisia) 17,146
3 Morocco (Al Maghrib) 16,147
4 Italy (Italia) 11,252
5 Comoros (Komori) 8,806
6 Spain (España) 7,162
7 Portugal 6,910
8 Turkey (Türkiye) 6,398
9 Romania (România) 3,716
10 Haïti 3,082
11 Madagascar (Madagasikara) 2,830
12 Sénégal 2,709
13 Vietnam (Việt Nam), Socialist Republic of 2,698
14 Belgium, Kingdom of 2,293
15 Germany (Deutschland) 2,285
16 Russian Federation (Russia) 2,170
17 China, People's Republic of 1,667
18 Lebanese Republic (Lebanon) 1,633
19 Poland (Polska) 1,564
20 United Kingdom 1,540
21 Serbia (Srbija) 1,093
22 Cameroon 1,062
23 Cambodia (Kampuchea) 997
24 United States of America 870
25 Brasil 859
26 Côte d'Ivoire 833
27 Mauritius (Maurice) 673
28 Guinea (Guinée) 616
29 Netherlands (Nederland) 596
30 Congo, Republic of the 548
Total Foreign-born (excludes Territories, Departments, etc.): 191,119
Urban Area Population: 1,752,398
...then it's off to the West we go to...

Image Source: wikimedia.org
Top 30 Non-France countries or places of birth
Toulouse, France 2015
1 Algeria (Al Jaza'ir) 19,544
2 Morocco (Al Maghrib) 16,863
3 Spain (España) 11,709
4 Portugal 10,867
5 Italy (Italia) 6,593
6 Tunisian Republic (Tunisia) 4,855
7 United Kingdom 3,459
8 Germany (Deutschland) 3,179
9 Romania (România) 2,974
10 Madagascar (Madagasikara) 2,365
11 Vietnam (Việt Nam), Socialist Republic of 2,211
12 Turkey (Türkiye) 1,961
13 Côte d'Ivoire 1,772
14 China, People's Republic of 1,737
15 Belgium, Kingdom of 1,686
16 Sénégal 1,622
17 Cameroon 1,411
18 Russian Federation (Russia) 1,397
19 Brasil 1,202
20 Poland (Polska) 1,189
21 Congo (Zaire), Democratic Republic of the 1,017
22 Colombia 993
23 United States of America 953
24 Congo, Republic of the 922
25 Cambodia (Kampuchea) 808
26 Guinea (Guinée) 716
27 Angola 705
28 Lebanese Republic (Lebanon) 672
29 Netherlands (Nederland) 610
30 Mauritius (Maurice) 574
Total Foreign-born (excludes Territories, Departments, etc.): 128,080
Urban Area Population: 1,330,954
...just a slight turn up -- to the northwest to...

Image Source: wikimedia.org
Top 30 Non-France countries or places of birth
Bordeaux, France 2015
1 Portugal 14,493
2 Morocco (Al Maghrib) 13,158
3 Algeria (Al Jaza'ir) 8,548
4 Spain (España) 7,118
5 Turkey (Türkiye) 3,849
6 Tunisian Republic (Tunisia) 2,400
7 Italy (Italia) 2,058
8 Sénégal 1,907
9 Romania (România) 1,754
10 United Kingdom 1,607
11 Cameroon 1,559
12 Madagascar (Madagasikara) 1,477
13 China, People's Republic of 1,372
14 Germany (Deutschland) 1,249
15 Belgium, Kingdom of 1,195
16 Vietnam (Việt Nam), Socialist Republic of 1,184
17 Côte d'Ivoire 1,169
18 Russian Federation (Russia) 1,036
19 Congo, Republic of the 1,010
20 Poland (Polska) 777
21 Congo (Zaire), Democratic Republic of the 722
22 Brasil 704
23 United States of America 560
24 Lebanese Republic (Lebanon) 512
25 Guinea (Guinée) 505
26 Colombia 482
27 Cambodia (Kampuchea) 448
28 Netherlands (Nederland) 397
29 Mauritius (Maurice) 365
30 Serbia (Srbija) 361
Total Foreign-born (excludes Territories, Departments, etc.): 91,300
Urban Area Population: 1,215,769
and now we go to the far north near Belgium to...

Image Source: jimcdn.com/europeanbestdestinations.com
Top 30 Non-France countries or places of birth
Lille (French part), France 2015
1 Algeria (Al Jaza'ir) 28,111
2 Morocco (Al Maghrib) 19,735
3 Portugal 7,329
4 Belgium, Kingdom of 6,513
5 Italy (Italia) 3,868
6 Tunisian Republic (Tunisia) 2,965
7 Turkey (Türkiye) 2,328
8 Spain (España) 2,192
9 Romania (România) 1,885
10 Congo (Zaire), Democratic Republic of the 1,818
11 Poland (Polska) 1,719
12 Cameroon 1,579
13 China, People's Republic of 1,400
14 Guinea (Guinée) 1,271
15 Sénégal 1,228
16 Germany (Deutschland) 1,010
17 Congo, Republic of the 984
18 Côte d'Ivoire 805
19 Cambodia (Kampuchea) 762
20 Vietnam (Việt Nam), Socialist Republic of 757
21 United Kingdom 734
22 Russian Federation (Russia) 648
23 Brasil 573
24 Lebanese Republic (Lebanon) 566
25 Madagascar (Madagasikara) 563
26 Serbia (Srbija) 522
27 Netherlands (Nederland) 411
28 United States of America 333
29 India (Bhārat) 325
30 Mauritius (Maurice) 259
Total Foreign-born (excludes Territories, Departments, etc.): 106,661
Urban Area Population: 1,184,708
...and last but not least we travel back to the Mediterranean Sea to...

Image Source: wikimedia.org
Top 30 Non-France countries or places of birth
Nice, France 2015
1 Tunisian Republic (Tunisia) 21,421
2 Italy (Italia) 18,713
3 Morocco (Al Maghrib) 13,105
4 Algeria (Al Jaza'ir) 10,755
5 Portugal 7,930
6 United Kingdom 4,737
7 Russian Federation (Russia) 3,803
8 Belgium, Kingdom of 3,612
9 Romania (România) 3,366
10 Spain (España) 3,335
11 Germany (Deutschland) 2,629
12 Poland (Polska) 1,995
13 Sénégal 1,568
14 Vietnam (Việt Nam), Socialist Republic of 1,252
15 Netherlands (Nederland) 1,203
16 United States of America 1,191
17 Comoros (Komori) 1,189
18 Turkey (Türkiye) 1,166
19 Lebanese Republic (Lebanon) 1,063
20 China, People's Republic of 1,009
21 Brasil 933
22 Switzerland (Swiss Confederation) 841
23 Serbia (Srbija) 839
24 Madagascar (Madagasikara) 793
25 Cambodia (Kampuchea) 653
26 Côte d'Ivoire 647
27 Cameroon 602
28 Canada 515
29 India (Bhārat) 491
30 Japan 407
Total Foreign-born (excludes Territories, Departments, etc.): 136,093
Urban Area Population: 1,005,891
...there is much more to come, so stay tuned! Norway, Italy & Jordan are among the others that are to follow.


 Prev
Prev


 Linear Mode
