HomeDiagramsDatabaseMapsForum About
     

Go Back   SkyscraperPage Forum > Discussion Forums > Transportation


Reply

 
Thread Tools Display Modes
     
     
  #121  
Old Posted Oct 14, 2016, 12:36 AM
Doady's Avatar
Doady Doady is online now
Registered User
 
Join Date: Apr 2004
Posts: 4,738
Again, those numbers for RTL and STL are linked trips. Those are easy to find. But I need unlinked trips (boardings) to compare with US systems. Or least a way to calculate unlinked trips (e.g. transfer rate, ratio of unlinked trips vs linked trips).

Boardings per capita for Montreal is probably around 240.

Anyways, the graph was not meant to be complete. There are a lot of cities missing there, not just Montreal. Even if all data was available, fitting them all on there would not only be difficult, it is also not necessary for the purpose of the graph.
Reply With Quote
     
     
  #122  
Old Posted Jun 1, 2018, 6:47 AM
Doady's Avatar
Doady Doady is online now
Registered User
 
Join Date: Apr 2004
Posts: 4,738
Update for 2016:


Code:
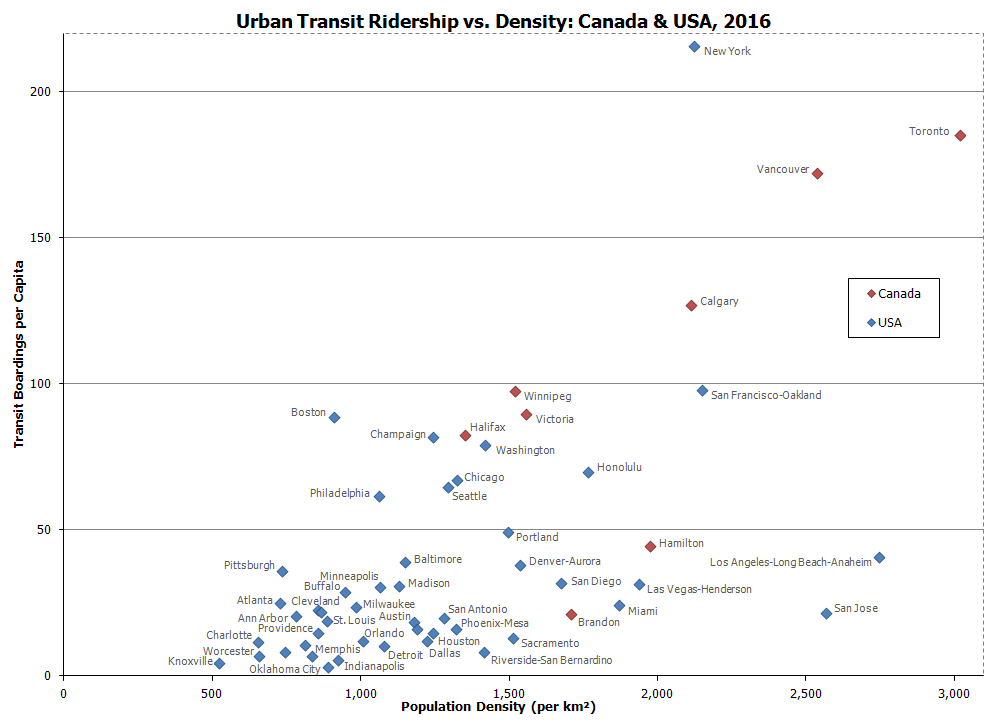
Urban Area               Population   Area  Density  UnlinkedTrips /Capita     Additional Urban Areas
New York-Newark          18,954,313  8,938    2,121  4,088,147,500   215.7
Toronto                   5,531,239  1,833    3,017  1,026,084,201   185.5     Milton
Vancouver                 2,358,552    930    2,536    406,842,500   172.5     White Rock
Calgary                   1,237,656    586    2,112    157,595,300   127.3
San Francisco-Oakland     4,500,719  2,096    2,148    441,116,300    98.0     Concord-Antioch
Winnipeg                    705,244    464    1,519     68,900,000    97.7
Victoria                    335,696    216    1,555     30,112,000    89.7
Boston                    4,406,447  4,852      908    391,100,000    88.8
Halifax                     316,701    235    1,349     26,200,000    82.7
Champaign                   150,682    121    1,243     12,331,200    81.8
Washington                5,099,463  3,600    1,416    403,638,400    79.2     Waldorf
Urban Honolulu              954,755    541    1,764     66,815,300    70.0     Kailua-Kaneohe
Chicago                   9,076,303  6,853    1,324    609,603,400    67.2     Kenosha-Round Lake Beach-McHenry-Graylake
Seattle                   3,387,102  2,617    1,294    219,661,300    64.9
Philadelphia              5,665,401  5,336    1,062    349,557,900    61.7     Pottstown
Portland                  2,028,282  1,358    1,494    100,037,600    49.3
Hamilton                    693,645    352    1,972     30,938,960    44.6
LA-Long Beach-Anaheim    12,882,231  4,695    2,744    527,430,100    40.9     Santa Clarita
Baltimore                 2,574,556  2,246    1,146    100,504,600    39.0     Aberdeen-Bel Air-Westminster-Eldersburg
Denver-Aurora             2,657,289  1,729    1,537    100,797,900    37.9
Pittsburgh                1,806,805  2,461      734     65,194,200    36.1     Monessen-California
San Diego                 3,172,773  1,897    1,672    101,156,100    31.9
Las Vegas-Henderson       2,090,708  1,080    1,936     65,901,900    31.5
Madison                     441,435    391    1,129     13,582,400    30.8
Minneapolis-St. Paul      2,811,122  2,647    1,062     85,503,800    30.4
Buffalo                     931,311    984      947     26,791,400    28.8
Atlanta                   4,970,669  6,850      726    124,421,700    25.0
Miami                     5,992,775  3,204    1,871    145,846,900    24.3
Milwaukee                 1,517,045  1,541      984     36,041,100    23.8     Racine
Cleveland                 1,935,958  2,263      855     43,857,300    22.7     Lorain-Elyria
Rochester                   726,102    840      864     15,852,900    21.8
San Jose                  1,898,885    740    2,566     41,306,300    21.8     Gilroy-Morgan Hill
Brandon                      48,324     28    1,706      1,023,300    21.2
Ann Arbor                   323,077    413      782      6,661,600    20.6
San Antonio               1,979,043  1,547    1,280     39,445,200    19.9
St. Louis                 2,243,567  2,534      885     42,249,400    18.8     Alton
Austin                    1,679,140  1,425    1,178     31,124,100    18.5     San Marcos
New Orleans               1,156,444    973    1,189     18,672,500    16.1     Slidell-Mandeville-Covington
Phoenix-Mesa              4,216,360  3,196    1,319     67,414,200    16.0     Avondale-Goodyear
Houston                   6,022,828  4,845    1,243     89,244,700    14.8     Conroe-The Woodlands-Texas City
Providence                1,206,706  1,412      855     17,813,105    14.8
Sacramento                1,846,331  1,220    1,514     24,052,700    13.0
Dallas-Ft Worth-Arlington 6,335,966  5,180    1,223     76,543,700    12.1     Denton-Lewisville-McKinney
Orlando                   2,224,371  2,207    1,008     26,516,300    11.9     Kissimmee-Leesburg-Eustis-Tavares-Deltona
Charlotte                 1,958,023  2,994      654     23,229,900    11.9     Gastonia-Concord-Rock Hill
Cincinnati                1,772,734  2,186      811     18,727,400    10.6     Middletown
Detroit                   3,725,215  3,461    1,076     38,880,895    10.4
Nashville-Davidson        1,234,859  1,660      744     10,316,800     8.4     Mursfreesboro
Riverside-San Bernardino  3,117,876  2,203    1,415     25,357,300     8.1     Murrieta-Temecula-Menifree-Indio-Cathedral City-Hemet
Worcester                   516,888    788      656      3,599,241     7.0
Memphis                   1,074,600  1,288      834      7,459,800     6.9
Indianapolis              1,684,034  1,828      921      9,466,600     5.6
Knoxville                   593,182  1,135      523      2,770,800     4.7
Oklahoma City             1,047,211  1,180      887      3,199,700     3.1     Norman	
Reply With Quote
     
     
  #123  
Old Posted Jun 2, 2018, 2:59 AM
a very long weekend's Avatar
a very long weekend a very long weekend is offline
dazzle me
 
Join Date: Jan 2014
Location: 94109
Posts: 824
Man, for how incredibly poor the Toronto transportation system is compared to what you'd expect for a Canuck city, that's a really great number. Montreal should be included on this list, the transit system up there is very good, in spite of how much worse the bus component is than the metro.
__________________
"Yes, we destroyed the planet. But in one brief, beautiful moment, we created tremendous value for shareholders."
Reply With Quote
     
     
  #124  
Old Posted Jun 2, 2018, 11:24 PM
Doady's Avatar
Doady Doady is online now
Registered User
 
Join Date: Apr 2004
Posts: 4,738
Montreal would be over 200 unlinked trips per capita right behind New York if I could find the STL and RTL numbers (or even a way to calcuate them). With only STM and AMT, Montreal would be behind Toronto, which would be misleading. So I could not include Montreal.

New York numbers are missing Bee Line Bus, NICE, and Suffolk County Transit which comprise about 60 million boardings. Toronto is missing Brampton Transit which is around 35 million boardings (23.1 million revenue riders or linked trips).

Here are some numbers for Europe to further compare:
Code:
Urban Area  Population      Boardings  /Capita
London      10,482,465  4,026,000,000  384.1
Oslo           943,084    350,000,000  371.5
Berlin       4,352,300  1,332,000,000  306.0
Paris       10,925,000  3,309,000,000  302.9
Amsterdam    1,117,000    234,000,000  209.5
Barcelona    4,790,000    954,500,000  199.3
Dublin       1,110,627    187,516,310  168.8
Birmingham   2,533,814    326,000,000  128.7
Manchester   2,651,901    270,000,000  101.8

Last edited by Doady; Jun 3, 2018 at 3:18 AM.
Reply With Quote
     
     
  #125  
Old Posted Jun 2, 2018, 11:51 PM
Crawford Crawford is online now
Registered User
 
Join Date: Nov 2003
Location: Brooklyn, NYC/Polanco, DF
Posts: 30,769
Quote:
Originally Posted by Doady View Post
New York numbers are missing Bee Line Bus, NICE, and Suffolk County Transit which comprise about 60 million boardings.
Those would not be major bus agencies. The major bus agencies in the NYC metro, excluding MTA Bus, would be NYC Bus (MTA but separate division) , and NJ Transit (both top 10 in the U.S.), and then the multitude of west-of-Hudson private carriers (ie most of the PA and GW terminal traffic). Beeline + the LI carriers combined probably aren't more than 10% of the non-MTA public carriers or 25% of the private lines.

And the NYC area has about 200k weekday ferry passengers, with major lines including SI Ferry (70k weekday), NYC Ferry (35k weekday) and NY Waterway (30k weekday).
Reply With Quote
     
     
  #126  
Old Posted Jun 3, 2018, 12:38 AM
GreaterMontréal's Avatar
GreaterMontréal GreaterMontréal is offline
Registered User
 
Join Date: Dec 2013
Posts: 4,580
Quote:
if I could find the STL and RTL numbers (or even a way to calcuate them). With only STM and AMT, Montreal would be behind Toronto, which would be misleading. So I could not include Montreal.
the STL (22M)- RTL (35M) , annual ridership of about 55M-60M. very stable

unlinked trips can't be find for the STL and the RTL.

the AMT no longer exists, replaced by EXO (Commuter rail + Express bus service)

EXO annual ridership, 21,109,600 (2016)
https://en.wikipedia.org/wiki/Exo_(public_transit)

Last edited by GreaterMontréal; Jun 3, 2018 at 1:06 AM.
Reply With Quote
     
     
  #127  
Old Posted Jun 3, 2018, 3:16 AM
Doady's Avatar
Doady Doady is online now
Registered User
 
Join Date: Apr 2004
Posts: 4,738
Quote:
Originally Posted by Crawford View Post
Those would not be major bus agencies. The major bus agencies in the NYC metro, excluding MTA Bus, would be NYC Bus (MTA but separate division) , and NJ Transit (both top 10 in the U.S.), and then the multitude of west-of-Hudson private carriers (ie most of the PA and GW terminal traffic). Beeline + the LI carriers combined probably aren't more than 10% of the non-MTA public carriers or 25% of the private lines.

And the NYC area has about 200k weekday ferry passengers, with major lines including SI Ferry (70k weekday), NYC Ferry (35k weekday) and NY Waterway (30k weekday).
The Bee-Line and LI buses also have around 200k weekday passengers. Even if they are tiny percent of the total, I wish I could have included them but oh well.

Quote:
Originally Posted by GreaterMontréal View Post
the STL (22M)- RTL (35M) , annual ridership of about 55M-60M. very stable

unlinked trips can't be find for the STL and the RTL.
The Canadian numbers are hard enough to find even for agencies and municipalities with English documentation. It's even harder for those that communicate in French only, and me not being able to read much French and not knowing the proper terminology in French. Even in England and Ireland, they use different terms compared to English Canada ("journeys" instead of "trips", and "passengers" instead of "riders", and "public transport" instead of "public transit").

I would estimate STL and RTL total around 80 million unlinked trips or boardings annually, so Montreal would be around 730M unlinked trips, or 207 per capita.
Reply With Quote
     
     
End
 
 
Reply

Go Back   SkyscraperPage Forum > Discussion Forums > Transportation
Forum Jump


Forum Jump


All times are GMT. The time now is 10:01 PM.

     
SkyscraperPage.com - Archive - Privacy Statement - Top

Powered by vBulletin® Version 3.8.7
Copyright ©2000 - 2024, vBulletin Solutions, Inc.