HomeDiagramsDatabaseMapsForum About
     

Go Back   SkyscraperPage Forum > Discussion Forums > City Discussions


Reply

 
Thread Tools Display Modes
     
     
  #61  
Old Posted Mar 15, 2011, 3:13 PM
Lipani Lipani is offline
It could be worse!
 
Join Date: Nov 2010
Location: San Diego
Posts: 1,194
Quote:
Originally Posted by Gordo View Post
I've mentioned before on many of the local threads that SF's NIMBY reputation is overblown.
Agreed. I'd think of Palo Alto, or as you mentioned, Cupertino, before SF when it comes to NIMBYs in the Bay Area.
Reply With Quote
     
     
  #62  
Old Posted Mar 15, 2011, 5:35 PM
krudmonk's Avatar
krudmonk krudmonk is offline
Of Heart's Delight
 
Join Date: Jun 2007
Location: Sannozay
Posts: 1,658
*ahem*THE WHOLE PENINSULA*ahem*
__________________
real cities are full of fake people
Reply With Quote
     
     
  #63  
Old Posted Mar 15, 2011, 5:52 PM
Gordo's Avatar
Gordo Gordo is offline
Registered User
 
Join Date: Jul 2007
Location: Seattle, WA/San Francisco, CA/Jackson Hole, WY
Posts: 4,201
^Plus all of Marin, most of the East Bay, etc. Until last year's court-ordered change, Pleasanton had a law on the books explicitly capping the number of residences allowed in the city.

To be fair though, Redwood City and San Mateo have been better than the rest of the cities on the peninsula. Both at least have plans for significant additional housing, though the plans are far from ideal. Similarly, Mountain View and Sunnyvale have been much better than some of the other Silicon Valley cities.

Last edited by Gordo; Mar 15, 2011 at 6:11 PM.
Reply With Quote
     
     
  #64  
Old Posted Mar 15, 2011, 6:51 PM
fflint's Avatar
fflint fflint is offline
Triptastic Gen X Snoozer
 
Join Date: Jul 2001
Location: San Francisco
Posts: 22,207
There is still an army of pony-tailed NIMBY scum in San Francisco. As JChurch rightly points out whenever the subject comes up, these are the people who believe the City was perfect the day they moved here, back in 1971 or whenever. They don't like change of any kind, and that's why they fight everything, from towers to townhouses to bike lanes to new stores. They're still around and they're still active.

What changed was their ability to keep up with new projects, coalesce, and then obstruct. The sheer volume of new projects in the boom years--I'd say from about 2003 to 2008--overwhelmed the NIMBYs and kept their obstruction in check. In the aftermath of the dot-com bust, there were only 1500 units on average getting proposed and built in the city each year. It was just easier for NIMBYs to find and obstruct the bigger projects when so few were proposed. As the decade progressed, however, the number of proposals exploded (right up until the recession). The decade total, it turns out, was the equivalent of 3,000 units per year--but most of the new units were built mid- or late-decade. By the time Rincon Hill and Mission Bay and Hayes Valley were booming, there were just too many proposals for the NIMBYs to stop. They had to pick their battles, usually with the highest profile towers, and had some success in lowering project totals. Yet the momentum was with the developers--and as the battles raged over Market-Octavia and Rincon Hill, all these five story buildings randomly scattered around the eastern neighborhoods flew completely under their radar. As a result, we have 30,000 new homes in the city.
__________________
"You need both a public and a private position." --Hillary Clinton, speaking behind closed doors to the National Multi-Family Housing Council, 2013
Reply With Quote
     
     
  #65  
Old Posted Mar 15, 2011, 7:48 PM
fflint's Avatar
fflint fflint is offline
Triptastic Gen X Snoozer
 
Join Date: Jul 2001
Location: San Francisco
Posts: 22,207
A glance at new housing construction during the 2000s in some selected Bay Area cities may shed light on which cities suffer from chronic NIMBYism:

City - Housing Units 2000 - Housing Units 2010

San Francisco - 346,527 - 376,942
San Jose - 281,841 - 314,038
Oakland - 157,508 - 169,710
Fremont - 69,452 - 73,989
Berkeley - 46,875 - 49,454
Concord - 45,083 - 47,125
Mountain View - 32,432 - 33,881
Walnut Creek - 31,425 - 32,681
Alameda - 31,644 - 32,351
Palo Alto - 26,048 - 28,216
San Rafael - 22,948 - 24,011
Emeryville - 4,274 - 6,646
__________________
"You need both a public and a private position." --Hillary Clinton, speaking behind closed doors to the National Multi-Family Housing Council, 2013
Reply With Quote
     
     
  #66  
Old Posted Mar 15, 2011, 8:50 PM
Gordo's Avatar
Gordo Gordo is offline
Registered User
 
Join Date: Jul 2007
Location: Seattle, WA/San Francisco, CA/Jackson Hole, WY
Posts: 4,201
^Very interesting, thanks for compiling that.
Reply With Quote
     
     
  #67  
Old Posted Mar 15, 2011, 9:17 PM
CyberEric CyberEric is offline
Registered User
 
Join Date: Aug 2010
Posts: 639
Not sure how I missed this thread. All very very interesting stuff.

So SF proper has more housing units than SJ proper? That means smaller families doesn't it?

The most shocking to me was the increase of the Asian population in SF and elsewhere. 30k more Asians moving just to SF proper is pretty amazing.
Also the drop in the black population, particularly in Oakland is interesting as well.

Did the SF Bay Area metro area surpass any other metros this census? Oh wait, they probably still have it as two metros, flippin' moronic.
Reply With Quote
     
     
  #68  
Old Posted Mar 17, 2011, 8:59 PM
pesto pesto is offline
BANNED
 
Join Date: Jul 2009
Posts: 2,546
Quote:
Originally Posted by tech12 View Post
Uhh, ok...except i think you forgot the part where black and latino people are not the same, and i think you also forgot the part where the latino population has grown, basically everywhere, including the three large Bay Area cities (did you miss those stats i posted?). So why do you say there was a decrease in latino people in SF and Oakland? There wasn't. Let me repeat myself: they are both at their HIGHEST latino populations ever, both in raw numbers and as a percentage. The only way for you to say that they lost latino population is for you to arbitrarily combine the latino and black populations. Just like the only way for you to claim that SJ's black population grew (it didn't... because it SHRUNK) is to combine them with Latinos. Do you not see what's wrong with that when posting demographic stats?
I'm not arguing any particular position so I'll just assume my writing isn't very clear. To be as specific as possible: the sum of the percentage of black people and Hispanic people in SF and Oakland went down; and the sum of the percentage of black people and Hispanic people in SJ went up (see the numbers in my first post). I did not assert that raw numbers of Latinos went up or down and I did not assert that raw numbers of black went up or down.

I'm not sure what is odd about combining these two groups. Literally thousands of studies every year, from educational performance to university admissions to jury awards to drunk driving arrests to mortgage defaults, focus on these two groups. And, of course, percentages are generally more relevant than raw numbers for most statistical studies.
Reply With Quote
     
     
  #69  
Old Posted Mar 17, 2011, 10:10 PM
fflint's Avatar
fflint fflint is offline
Triptastic Gen X Snoozer
 
Join Date: Jul 2001
Location: San Francisco
Posts: 22,207
Quote:
Originally Posted by pesto View Post
I'm not arguing any particular position so I'll just assume my writing isn't very clear. To be as specific as possible: the sum of the percentage of black people and Hispanic people in SF and Oakland went down; and the sum of the percentage of black people and Hispanic people in SJ went up (see the numbers in my first post). I did not assert that raw numbers of Latinos went up or down and I did not assert that raw numbers of black went up or down.

I'm not sure what is odd about combining these two groups.
In the context of a forum discussion about the growth or decline of distinct racial/ethnic groups within three selected cities, it seems odd to randomly combine one group that has steeply declined in all three cities with a separate group that has rapidly grown in all three cities.

In this context, on this subject, these two groups are more different than similar. If one were to look only at your conclusions, one might be led to believe the number of Latinos had declined in San Francisco or Oakland, and the number of blacks increased in San Jose, when the opposite is true in all three cases.
__________________
"You need both a public and a private position." --Hillary Clinton, speaking behind closed doors to the National Multi-Family Housing Council, 2013
Reply With Quote
     
     
  #70  
Old Posted Mar 19, 2011, 3:29 AM
fflint's Avatar
fflint fflint is offline
Triptastic Gen X Snoozer
 
Join Date: Jul 2001
Location: San Francisco
Posts: 22,207
Census 2010: Where the Children Aren't
Bay Area counties have slow or no growth in their populations of children, thanks to costly housing and fewer jobs, say demographers

http://www.baycitizen.org/census-201...ldren-arent/2/

Children are a disappearing presence in the Bay Area, the 2010 census shows, with slow growth or a net loss of the under-18 set in the region's nine counties, as families with young children move to areas with cheaper housing and better job opportunities. But diversity of the youth population is increasing as white and black families leave and are replaced by Asian and Latino families with young kids.

....The Bay Area’s kid drain is a reflection of a statewide trend that was in evidence in the last census, says John Logan, a sociology professor at Brown University and director of the US2010 Project. “I thought it very revealing that statewide, California actually lost under-18 population of both blacks and non-Hispanic whites,” Logan said. “Young families are not moving to California.”

....San Franciso’s total under-18 population dropped by 4.7 percent, but the number of white kids increased by nearly 3,000, a spurt likely owed to middle and upper-middle class young couples coming to the city, Frey said.
__________________
"You need both a public and a private position." --Hillary Clinton, speaking behind closed doors to the National Multi-Family Housing Council, 2013
Reply With Quote
     
     
  #71  
Old Posted Mar 20, 2011, 7:22 PM
dimondpark's Avatar
dimondpark dimondpark is offline
Pay it Forward
 
Join Date: Apr 2003
Location: Piedmont, California
Posts: 7,894
So we were comparing diversity in another forum and in order to compare similar geographic sizes, I came up with this:

Los Angeles County: 4,060 square miles

vs.

Alameda/Contra Costa/Sacramento/San Joaquin/Solano Counties: 4,647 square miles
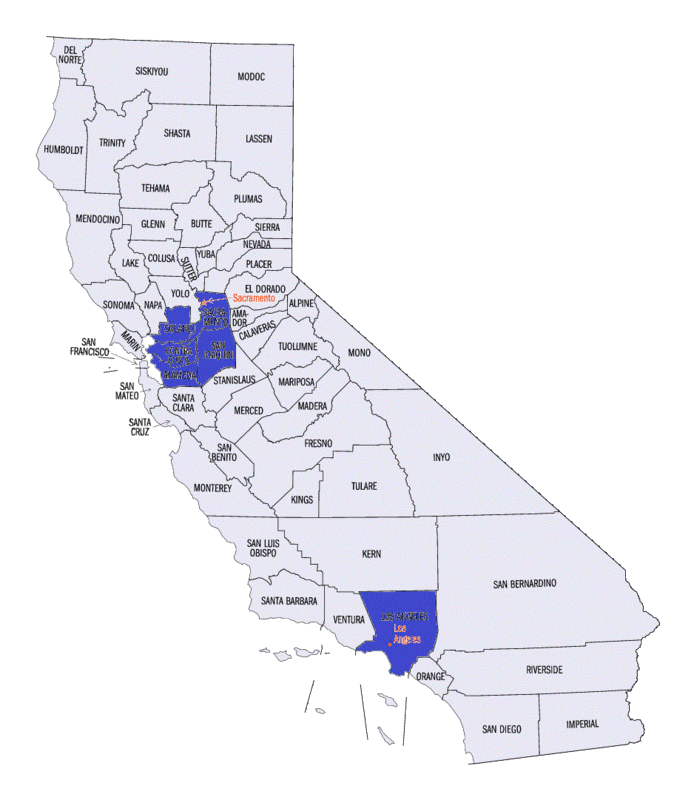

http://i107.photobucket.com/albums/m...f?t=1300646968


Los Angeles County
Total Population 9,818,605

Hispanic.....................................4,687,889....................47.7%
Non Hispanic White.......................2,728,321...................27.7%
Asian.........................................1,325,671....................13.4%
Black............................................815,086.....................8.3%
Two or more Races..........................194,921....................1.9%
Some other Race..............................25,367.....................0.6%
Native Hawaiian/Pac. Islander.............22,464.....................0.2%
American Indian...............................18,886......................0.1%

Alameda/Contra Costa/Sacramento/San Joaquin/Solano
Total Population 5,076,734

Non Hispanic White.......................2,117,195....................41.7%
Hispanic......................................1,267,342....................24.9%
Asian............................................891,923....................17.5%
Black.............................................524,962....................10.3%
Two or More Races..........................205,741.....................4.0%
Native Hawaiian/Pac. Islander.............35,903......................0.7%
American Indian................................20,091.....................0.4%
Some other Race..............................13,577......................0.2%

Conclusion:
The Norcal 5 have a higher percentage of Non Hispanic Whites, Asians, Blacks, Multiracial, Native Hawaiian/Pacific Islander and American Indians.

LA County has a higher percentage of Hispanics and people who identify themselves as Some other Race.
__________________

"Two roads diverged in a wood, and I—I took the one less traveled by, And that has made all the difference."-Robert Frost
Reply With Quote
     
     
  #72  
Old Posted Mar 21, 2011, 3:39 PM
M II A II R II K's Avatar
M II A II R II K M II A II R II K is offline
Registered User
 
Join Date: Aug 2002
Location: Toronto
Posts: 52,200
The Oakland renaissance


March 20, 2011

By Irene Lechowitzky

Read More: http://www.latimes.com/travel/la-tr-...157,full.story

Quote:
Oakland is feeling its oats. Steel-cut oats, that is. Sprinkled atop a puree of onion soup ladled over smoked dates at the Michelin-starred Commis, this coarse grain is being transformed into something wonderful and different, much like the rough-hewn city itself. Best known for its rowdy Raiders and crime-heavy headlines, Oakland has changed for the better in recent years. There are trendy shops and nightclubs, modern condos cheek-to-cheek with restored Art Deco gems and an influx of top chefs, lured by cheaper rents from San Francisco and Berkeley's gourmet ghettos.

Despite its large size (56 square miles, from the waterfront to the hills), Oakland and its neighborhoods are easily accessible, and some are just a mile or two apart. A car is best, but BART trains and city buses are convenient. Uptown has great bones, with blocks of historic buildings (in varying states of repair) and striking architecture. Like many urban areas, it went from bustling in the 1920s to broken within a few decades. Iconic structures such as the I. Magnin building dot the area, but it was the restoration of two grand dames that jump-started the neighborhood's resurgence as a night-life and arts magnet.

The Fox Theater, a 1928 Moorish gem on Telegraph Avenue, and the Paramount Theatre, a Depression-era Art Deco beauty on Broadway, give heft to the Uptown culture boom. The Fox reopened in 2009 as an indie music venue after a multimillion-dollar renovation; the Paramount is home to the Oakland East Bay Symphony. There's been a mini-population boom as well, sparked by former Mayor Jerry Brown's efforts to boost housing. Though the boom was stalled by the recession, hundreds of residents have moved into new condos and apartments.

.....


In Oakland, patrons enjoy the outdoors at the Lake Chalet Seafood Bar & Grill overlooking Lake Merritt. (Irene Lechowitzky)

__________________
ASDFGHJK
Reply With Quote
     
     
  #73  
Old Posted Mar 21, 2011, 6:35 PM
CyberEric CyberEric is offline
Registered User
 
Join Date: Aug 2010
Posts: 639
Quote:
Originally Posted by dimondpark View Post
So we were comparing diversity in another forum and in order to compare similar geographic sizes, I came up with this:

Los Angeles County: 4,060 square miles

vs.

Alameda/Contra Costa/Sacramento/San Joaquin/Solano Counties: 4,647 square miles


http://i107.photobucket.com/albums/m...f?t=1300646968


Los Angeles County
Total Population 9,818,605

Hispanic.....................................4,687,889....................47.7%
Non Hispanic White.......................2,728,321...................27.7%
Asian.........................................1,325,671....................13.4%
Black............................................815,086.....................8.3%
Two or more Races..........................194,921....................1.9%
Some other Race..............................25,367.....................0.6%
Native Hawaiian/Pac. Islander.............22,464.....................0.2%
American Indian...............................18,886......................0.1%

Alameda/Contra Costa/Sacramento/San Joaquin/Solano
Total Population 5,076,734

Non Hispanic White.......................2,117,195....................41.7%
Hispanic......................................1,267,342....................24.9%
Asian............................................891,923....................17.5%
Black.............................................524,962....................10.3%
Two or More Races..........................205,741.....................4.0%
Native Hawaiian/Pac. Islander.............35,903......................0.7%
American Indian................................20,091.....................0.4%
Some other Race..............................13,577......................0.2%

Conclusion:
The Norcal 5 have a higher percentage of Non Hispanic Whites, Asians, Blacks, Multiracial, Native Hawaiian/Pacific Islander and American Indians.

LA County has a higher percentage of Hispanics and people who identify themselves as Some other Race.
I can't quite figure out why you chose the counties you did: no SF, Peninsula or South Bay counties?

Quote:
Originally Posted by M II A II R II K View Post
The Oakland renaissance


March 20, 2011

By Irene Lechowitzky

Read More: http://www.latimes.com/travel/la-tr-...157,full.story


In Oakland, patrons enjoy the outdoors at the Lake Chalet Seafood Bar & Grill overlooking Lake Merritt. (Irene Lechowitzky)

Glad to see Oakland getting some positive press. Interesting that they consider 56 sq miles "large."
Reply With Quote
     
     
  #74  
Old Posted Mar 21, 2011, 8:22 PM
dimondpark's Avatar
dimondpark dimondpark is offline
Pay it Forward
 
Join Date: Apr 2003
Location: Piedmont, California
Posts: 7,894
Quote:
Originally Posted by CyberEric View Post
I can't quite figure out why you chose the counties you did: no SF, Peninsula or South Bay counties?
2 reasons.

1. Well the specific issue was Black diaspora in Northern California and clearly the trend is from the inner East Bay to the outer East Bay and surrounding valley counties.

2. I deliberately left out SF, The Peninsula and South Bay to demonstrate to people who dont know that the East Bay by itself is statistically on par with Los Angeles-and in the case of this comparison, actually MORE diverse.

Quote:

Glad to see Oakland getting some positive press. Interesting that they consider 56 sq miles "large."
Actually for the past few years, Oakland has been getting tons of positive press from outside the Bay Area. The New York Times, the Wall Street Journal, LA Times etc have all done lots of pieces on Oakland's cultural resurgence that has transformed it into a bonafide food and arts mecca.

Its the Bay Area's own biased media that has been rather late to the party.
__________________

"Two roads diverged in a wood, and I—I took the one less traveled by, And that has made all the difference."-Robert Frost
Reply With Quote
     
     
  #75  
Old Posted Mar 21, 2011, 9:33 PM
CyberEric CyberEric is offline
Registered User
 
Join Date: Aug 2010
Posts: 639
Quote:
Originally Posted by dimondpark View Post
2 reasons.

1. Well the specific issue was Black diaspora in Northern California and clearly the trend is from the inner East Bay to the outer East Bay and surrounding valley counties.

2. I deliberately left out SF, The Peninsula and South Bay to demonstrate to people who dont know that the East Bay by itself is statistically on par with Los Angeles-and in the case of this comparison, actually MORE diverse.


Actually for the past few years, Oakland has been getting tons of positive press from outside the Bay Area. The New York Times, the Wall Street Journal, LA Times etc have all done lots of pieces on Oakland's cultural resurgence that has transformed it into a bonafide food and arts mecca.

Its the Bay Area's own biased media that has been rather late to the party.
I see, thanks for the explanation. I thought it was known that Alameda county is the most diverse in the country.
Reply With Quote
     
     
  #76  
Old Posted Mar 22, 2011, 4:09 AM
dktshb's Avatar
dktshb dktshb is offline
Environmental Sabotage
 
Join Date: Jun 2005
Location: San Francisco/ Los Angeles/ Tahoe
Posts: 5,054
Quote:
Originally Posted by dimondpark View Post
2 reasons.

1. Well the specific issue was Black diaspora in Northern California and clearly the trend is from the inner East Bay to the outer East Bay and surrounding valley counties.

2. I deliberately left out SF, The Peninsula and South Bay to demonstrate to people who dont know that the East Bay by itself is statistically on par with Los Angeles-and in the case of this comparison, actually MORE diverse.
So how diverse is that 41% that identify as non Hispanic white amd how diverse is the 17% that identify as Asian, etc.? I just don't see how you can conclude any area is more diverse over another using these statistics. Don't you think it's a tad bit of an over simplification?
Reply With Quote
     
     
  #77  
Old Posted Mar 22, 2011, 9:18 PM
dimondpark's Avatar
dimondpark dimondpark is offline
Pay it Forward
 
Join Date: Apr 2003
Location: Piedmont, California
Posts: 7,894
Quote:
Originally Posted by dktshb View Post
So how diverse is that 41% that identify as non Hispanic white amd how diverse is the 17% that identify as Asian, etc.? I just don't see how you can conclude any area is more diverse over another using these statistics. Don't you think it's a tad bit of an over simplification?
Well this point has been made before and it obviously has its merits.

Actually this the most broad way to determine diversity without going deeper into actual ancestries, ethnic groups and ancestries represented, which is fine too, but we dont have that data yet. Based on the data we do have, the 5 counties in NorCal that I combined are more diverse than LA County. First of all, LAs two largest groups combine to constitute three-fourths, or 75.4% of the entire population. In the NorCal counties the two largest groups constitute two-thirds, or 66.6% of the entire population.

In NorCal, 4 groups account for at least 10% compared to 3 groups for LA. And then in the smaller groups, proportionally speaking, the NorCal counties have twice as many Biracial people, three times as many Polynesians, four times as many Native Americans as LA County. As far as the larger groups, the NorCal counties have a greater proportion of Blacks, Whites and Asians as well. The only groups LA has a greater proportion in are Hispanics and those who claim to be of some other race(and that still only accts for .6%).

Even if we get mathematical about it:

We need only follow this formula:
Quote:
For the 2000 census, the US census released a diversity index (http://www.census.gov/population/cen...ensr01-104.pdf) calculating the statistical diversity of each county in the United States based on the 8 broad ethno-racial demographic groups seen in the census. If you look on the 4th page of the link above, the census demographers use simple mathematics to determine how they got the index to begin with:

1) Square the percentage of each group analyzed
2) Subtract that number from 1.00 (total diversity)


The range of diversity is from .00 (no diversity at all) to 1.00 (total diversity).
So following that, LA scored .671 and the Norcal 5 scored .722 which to make it easier to understand, the chances of the next person you meet in LA county being different from you is 67.1%--whereas in those combined NorCal counties its 72.2%

Both incredibly high btw.
__________________

"Two roads diverged in a wood, and I—I took the one less traveled by, And that has made all the difference."-Robert Frost
Reply With Quote
     
     
  #78  
Old Posted Mar 23, 2011, 5:29 AM
dimondpark's Avatar
dimondpark dimondpark is offline
Pay it Forward
 
Join Date: Apr 2003
Location: Piedmont, California
Posts: 7,894
We may have limped to it, but...
The megalopolis around San Francisco records its 7th straight decade of adding 1 Million+ residents

San Francisco CSA /Sacramento CSA/Stockton MSA/Modesto MSA/Salinas MSA
Population
1940 2,526,054
1950 3,647,000
1960 5,066,320
1970 6,455,400
1980 7,530,800
1990 9,114,800
2000 10,435,800
2010 11,544,986

Net Population Change
1940-1950 +1,120,946(+44.3%)
1950-1960 +1,419,320(+38.9%)
1960-1970 +1,389,080(+27.4%)
1970-1980 +1,075,400(+16.6%)
1980-1990 +1,584,000(+21.0%)
1990-2000 +1,384,000(+15.1%)
2000-2010 +1,108,800(+10.1%)

Total Numerical Growth 1940-2010 +9,018,932

Total Percentage Growth 1940-2010 +457%
__________________

"Two roads diverged in a wood, and I—I took the one less traveled by, And that has made all the difference."-Robert Frost
Reply With Quote
     
     
  #79  
Old Posted Mar 25, 2011, 9:43 PM
tech12's Avatar
tech12 tech12 is offline
Registered User
 
Join Date: Sep 2005
Location: Oakland
Posts: 3,338
I was looking through census tract data, and noticed that the only big cities in CA with any tracts that are over 40% black are Los Angeles, Oakland, San Diego, and San Francisco. San Diego has one, San Francisco has 3, Oakland has 22, and LA has to have the most (i'm not sure where the borders are between LA and neighboring cities when looking at a map of census tracts, but LA has to be at the top here due to size).

When it comes to 60-80% black, SD has no tracts, then you have SF with one, Oakland with four, and LA looks like it has at least several. LA is the only big city that has any tracts above 80% though.

Also, the only big city in CA with no census tracts that are over 20% black is San Jose.

source: http://projects.nytimes.com/census/2010/map?hp
Reply With Quote
     
     
  #80  
Old Posted Mar 25, 2011, 10:57 PM
BevoLJ's Avatar
BevoLJ BevoLJ is offline
~Hook'em~
 
Join Date: Oct 2010
Location: Austin, TX/London, UK
Posts: 1,814
Quote:
Originally Posted by dimondpark View Post
We may have limped to it, but...
The megalopolis around San Francisco records its 7th straight decade of adding 1 Million+ residents
That is a hell of an accomplishment! I had not noticed that, thanks for pointing it out.
__________________
Austin, Texas
London, United Kingdom
Reply With Quote
     
     
This discussion thread continues

Use the page links to the lower-right to go to the next page for additional posts
 
 
Reply

Go Back   SkyscraperPage Forum > Discussion Forums > City Discussions
Forum Jump


Forum Jump


All times are GMT. The time now is 9:32 AM.

     
SkyscraperPage.com - Archive - Privacy Statement - Top

Powered by vBulletin® Version 3.8.7
Copyright ©2000 - 2024, vBulletin Solutions, Inc.