| |
 Posted Sep 5, 2018, 8:14 AM
|
 |
Registered User
|
|
Join Date: Apr 2004
Posts: 4,746
|
|
Transit and walking/cycling mode share of Canadian metropolitan areas in 2011:
Code:
Metro Area  Population  %Transit  %Active
Toronto      5,584,064     23.28     5.72
Montreal     3,934,078     22.24     7.09
Vancouver    2,313,328     19.71     8.08
Ottawa       1,236,324     20.10     8.55
Calgary      1,214,839     15.87     6.04
Edmonton     1,159,869     11.32     5.16
Quebec         767,310     11.34     7.46
Winnipeg       730,018     13.41     7.14
Hamilton       721,053      9.27     5.28
Kitchener      496,383      5.43     5.46
London         474,786      6.89     5.39
St. Catharines 392,184      2.94     6.00
Halifax        390,328     12.47     8.52
Oshawa         356,177      8.45     3.63
Victoria       344,177     11.08    15.89
Saskatoon      262,215      4.45     7.09
Regina         211,519      4.77     5.90
Sherbrooke     202,261      4.19     7.38
St. John's     196,954      2.98     5.66
Kingston       159,561      5.06    10.69
Guelph         141,097      6.24     6.63
Moncton        139,287      3.25     6.73
Saint John     129,057      4.72     5.30
Thunder Bay    121,596      3.58     6.27
Peterborough   118,975      3.48     8.63
Sarnia          97,131      2.10     5.38
North Bay       72,241      4.21    10.11
Charlottetown   65,523      1.98     6.56
Brandon         58,003      3.01     9.35
Timmins         41,788      5.26     7.55
Stratford       30,903      2.33    14.36
Whitehorse      26,028      4.86     9.52
Yellowknife     19,028      1.21    26.61
Transit and walking/cycling mode share of US metropolitan areas in 2011:
Code:
Metro Area    Population  %Transit  %Active
New York      19,015,900     31.11     6.76
Los Angeles   12,944,801      6.23     3.60
Chicago        9,504,753     11.69     3.74
Dallas         6,526,548      1.44     1.26
Houston        6,086,536      2.34     1.62
Philadelphia   5,992,414      9.28     4.27
Washington     5,703,948     14.79     3.77
Miami          5,670,125      3.81     2.18
Atlanta        5,268,860      3.08     1.74
Boston         4,552,402     11.62     6.11
San Francisco  4,391,037     14.58     6.13
Riverside      4,304,994      1.59     1.78
Detroit        4,285,832      1.63     1.54
Phoenix        4,263,236      2.16     2.66
Seattle        3,500,026      8.13     4.61
Minneapolis    3,318,486      4.69     2.87
San Diego      3,140,069      3.03     3.47
Tampa          2,824,724      1.24     2.25
St. Louis      2,817,355      2.40     2.01
Baltimore      2,729,110      6.12     2.85
Pittsburgh     2,359,746      5.55     3.63
Portland       2,262,605      6.33     5.63
San Antonio    2,194,927      2.14     2.16
Sacramento     2,176,235      2.73     4.00
Orlando        2,171,360      2.51     1.79
Cincinnati     2,138,038      2.05     2.20
Cleveland      2,068,283      3.22     2.44
Kansas City    2,052,676      1.20     1.40
Las Vegas      1,969,975      3.91     2.07
San Jose       1,865,450      3.37     4.06
Columbus       1,858,464      1.75     2.54
Charlotte      1,795,472      2.33     1.64
Austin         1,783,519      2.47     2.98
Indianapolis   1,778,568      1.18     2.01
Nashville      1,617,142      1.40     1.61
Providence     1,600,224      2.79     3.20
Milwaukee      1,562,216      4.00     3.31
Memphis        1,325,605      1.56     1.31
Louisville     1,294,849      1.92     1.98
Oklahoma City  1,278,053      0.49     2.08
Richmond       1,269,380      1.64     1.76
Hartford       1,213,255      3.74     3.12
New Orleans    1,191,089      2.74     3.90
Raleigh        1,163,515      1.09     1.58
Salt Lake City 1,145,905      3.59     2.63
Buffalo        1,134,039      3.68     3.27
Birmingham     1,132,264      0.67     1.25
Rochester      1,055,278      1.85     3.67
Honolulu         964,607      7.57     6.26
Tulsa            946,962      0.47     1.47
Omaha            877,110      0.91     2.03
New Haven        861,113      3.94     4.31
Grand Rapids     779,604      1.61     1.82
Columbia         777,116      0.66     3.92
Little Rock      709,901      0.56     1.33
Knoxville        704,500      0.44     1.15
Springfield      693,204      2.74     3.75
Des Moines       580,255      0.95     1.60
Scranton         563,223      1.37     3.60
Asheville        429,017      0.44     2.37
Anchorage        387,516      1.93     3.74
Savannah         355,576      2.02     2.31
Ann Arbor        347,962      6.54     8.22
Sioux Falls      232,433      0.93     3.00
Fargo            212,171      0.56     5.60
Saginaw          199,088      0.43     2.38
Athens           193,317      2.97     5.95
Eau Claire       161,151      0.73     4.28
Billings         160,097      1.47     4.15
Bangor           153,786      0.62     5.27
Ithaca           101,723      5.02    16.28
The numbers confirm that differences in transit usage in Canada are based heavily on the metropolitan area size. Therefore, metropolitan areas should only be compared their peers of similar size.
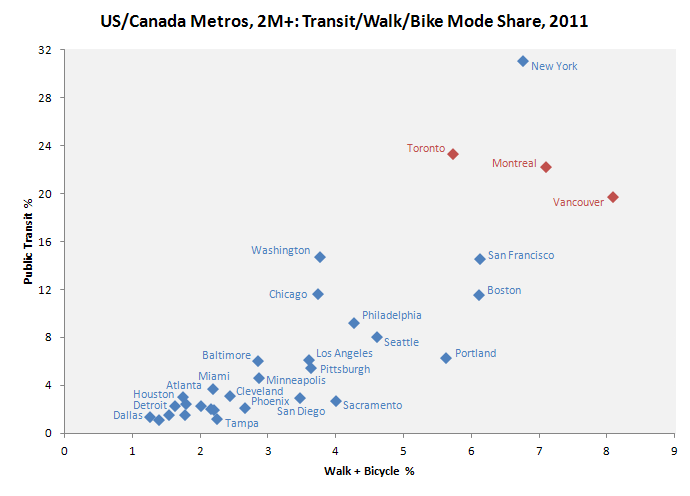
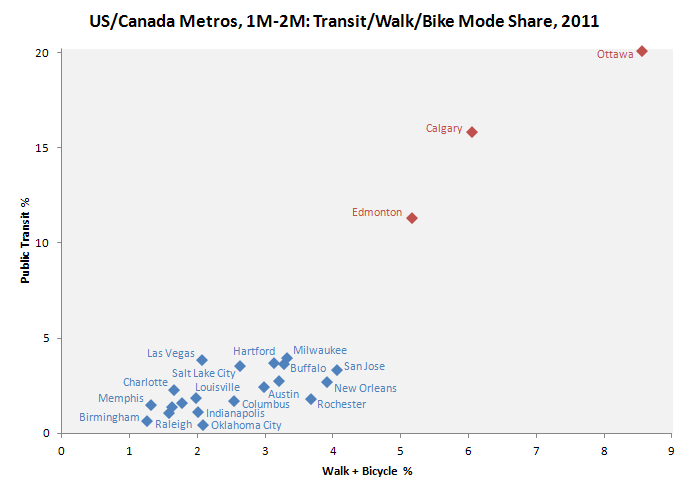
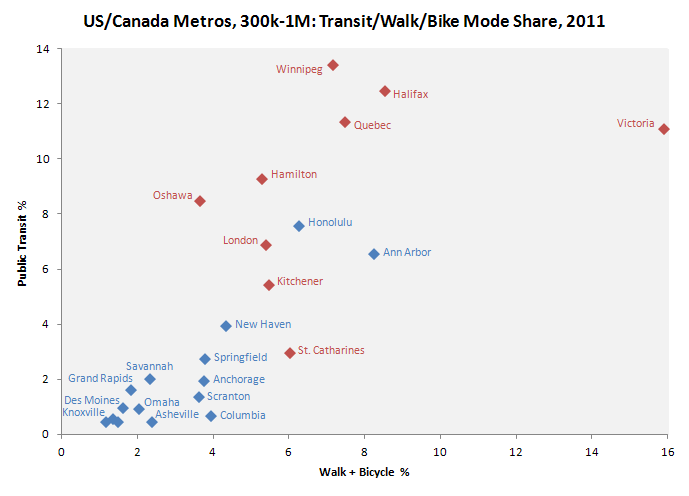
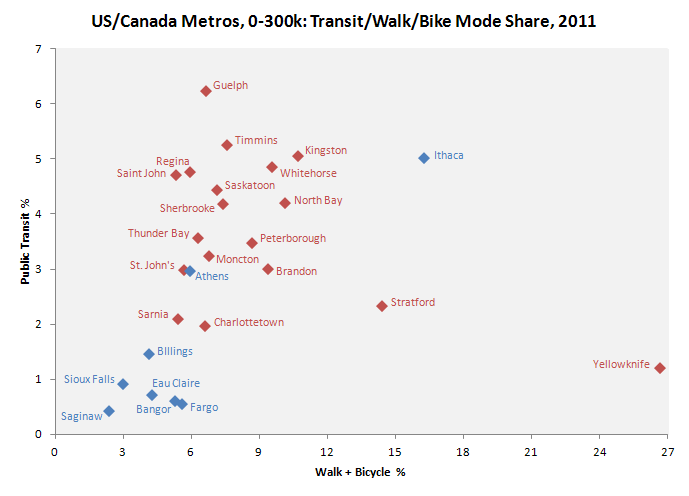
People in Canada are approximately 3 or 4 times more likely to use transit compared to people in similar sized metropolitan areas in the US. Canadians are also approximately 2 times more likely to walk or bicycle which suggests differences in the built environment. The graphs show some positive correlation between transit usage and walking/cycling. So getting people onto transit might not just be about providing more service but it might also require encouraging people to be more active as well.
Last edited by Doady; Sep 5, 2018 at 5:33 PM.
Reason: added Ottawa
|
|
|


 Prev
Prev


 Linear Mode
