HomeDiagramsDatabaseMapsForum About
     

Go Back   SkyscraperPage Forum > Discussion Forums > City Discussions


Reply

 
Thread Tools Display Modes
     
     
  #1  
Old Posted Sep 24, 2018, 5:16 AM
Urbanguy's Avatar
Urbanguy Urbanguy is offline
Go Beavs! Go Niners!
 
Join Date: Dec 2001
Location: Portland | Honolulu
Posts: 6,209
Ongoing: Diversity Worldwide (Countries, Metros or Cities)

We live in an ever changing world -- one where mobility has become easy, efficient and widespread. Some people move for economic reasons, some to escape war, corruption, famine, crime and so on but ultimately with a goal of a better way of life. Times have change significantly since the earliest days of exploration and so has the world in which we live, thanks to the many advancements in technology.

This thread can be viewed as a window into different countries, cultures, cities and metropolitan areas in which our world is occupied by. It is a world rich with diversity and hopefully this will give each of you a little more insight into these places that will be shared here.

I have done extensive research into collecting this information from a multitude of statistical resources and have tried to make them as uniform as I possibly could as not all countries share or collect information in the same way.

Demographics like foreign-born, language and diversity are quite popular topics here that occasionally lead to heated debates but hopefully this won't turn into that as these statistics are for learning, enjoyment and for the appreciation of the many places that make our planet unique.


Image Source: wolfram.com

Without further ado is the Commonwealth of Australia and select metropolitan areas and cities.

Capital: Canberra
Country Population: 23,401,851 (2016)

This from wikipedia: "Australia was inhabited by indigenous Australians for about 60,000 years before the first British settlement in the late 18th century. It is documented that Aborigines spoke languages that can be classified into about 250 groups. After the European discovery of the continent by Dutch explorers in 1606, who named it New Holland, Australia's eastern half was claimed by Great Britain in 1770 and initially settled through penal transportation to the colony of New South Wales from 26 January 1788, a date which became Australia's national day. The population grew steadily in subsequent decades, and by the 1850s most of the continent had been explored and an additional five self-governing crown colonies established. On 1 January 1901, the six colonies federated, forming the Commonwealth of Australia. Australia has since maintained a stable liberal democratic political system that functions as a federal parliamentary constitutional monarchy comprising six states and several territories."


Image Source: Amazon.com

Top 50 Non-Australian countries or places of birth

Australia 2016

1 United Kingdom 1,085,054
2 New Zealand (Aotearoa) 518,466
3 China, People's Republic of 509,555
4 India (Bhārat) 455,389
5 Philippines (Pilipinas), Republic of the 232,386
6 Vietnam (Việt Nam), Socialist Republic of 219,355
7 Italy (Italia) 174,042
8 South Africa, Republic of 162,449
9 Malaysia 138,364
10 Sri Lanka 109,849

11 Germany (Deutschland) 102,595
12 Korea, Republic of (South) 98,776
13 Greece (Hellenic Republic) 93,743
14 China, Hong Kong (Special Administrative Region) 86,886
15 United States of America 86,125
16 Lebanese Republic (Lebanon) 78,653
17 Ireland, Republic of (Éire) 74,888
18 Indonesia 73,213
19 Netherlands (Nederland) 70,172
20 Iraq 67,352

21 Thailand 66,229
22 Pakistan 61,913
23 Fiji Islands 61,469
24 Iran, Islamic Republic of 58,112
25 Singapore 54,939
26 Nepal 54,754
27 Taiwan 46,822
28 Afghanistan, Islamic Republic of 46,799
29 Poland (Polska) 45,368
30 Croatia (Hrvatska) 43,688

31 Canada 43,053
32 Japan 42,421
33 Bangladesh 41,237
34 Egypt, Arab Republic of 39,779
35 Macedonia (Makedonija), The former Yugoslav Republic of 38,985
36 Malta 37,613
37 Zimbabwe 34,787
38 Cambodia (Kampuchea) 33,149
39 Myanmar (Burma) 32,655
40 Turkey (Türkiye) 32,178

41 France 31,120
42 Papua New Guinea 28,800
43 Brasil 27,630
44 Chile 26,086
45 Mauritius (Maurice) 24,329
46 Samoa, Independent State of 24,017
47 Bosnia and Herzegovina 23,956
48 Russian Federation (Russia) 20,425
49 Serbia (Srbija) 20,201
50 Colombia 18,997

Total Foreign-born Population (excl. at sea, not stated, etc): 6,150,044
Total Population: 23,401,851
Source: Australian Bureau of Statistics (ABS), Census 2016

From all of the statistics that I've seen so far -- Australia has the largest population of people born in the United Kingdom, New Zealand, Papua New Guinea, Fiji and Malta of any other country, save for their country of origin. Australia also has one of the largest populations born in Singapore (possibly 2nd after Malaysia), South Africa (possibly 2nd after the UK), Samoa (2nd after New Zealand) and Malaysia outside of Asia.

Top 50 Most common languages spoken at home (non-English)

Australia 2016

1 Mandarin 596,703
2 Arabic 321,720
3 Cantonese 280,943
4 Vietnamese 277,391
5 Italian 271,602
6 Greek 237,583
7 Filipino/Tagalog 182,498
8 Hindi 159,637
9 Spanish 140,813
10 Punjabi 132,500

11 Persian/Dari 111,012
12 Korean 108,994
13 German 79,352
14 Tamil 73,161
15 French 70,878
16 Urdu 69,295
17 Indonesian 67,894
18 Macedonian 66,020
19 Australian Indigenous Languages 64,761
20 Sinhalese 64,613

21 Nepali 62,005
22 Turkish 58,356
23 Croatian 56,885
24 Japanese 55,958
25 Thai 55,438
26 Bengali 54,552
27 Serbian 53,800
28 Malayalam 53,203
29 Gujarati 52,871
30 Russian 50,312

31 Portuguese 48,856
32 Polish 48,070
33 Assyrian/Aramaic 45,690
34 Samoan 44,875
35 Afrikaans 43,748
36 Khmer 35,429
37 Telugu 34,434
38 Dutch 33,826
39 Maltese 31,993
40 Chinese, nfd 19,974

41 Hungarian 19,890
42 Malay 17,936
43 Min Nan (incl.Hokkien) 17,900
44 Tongan 17,694
45 Burmese 16,321
46 Bosnian 15,822
47 Somali 14,174
48 Marathi 13,057
49 Romanian 12,954
50 Dinka 12,692

Source: Australia Census 2016

Top 50 permanent additions to Australia in 2017 by country of birth - Newly settled immigrants.

Australia 2017

1 India 38,264 16.94%
2 China, People's Republic of 29,604 13.10%
3 United Kingdom 16,982 7.52%
4 Philippines 12,180 5.39%
5 Iraq 9,771 4.32%
6 Syria 8,229 3.64%
7 New Zealand 8,199 3.63%
8 Pakistan 6,315 2.79%
9 Vietnam 5,579 2.47%
10 South Africa, Republic of 5,397 2.39%

11 Malaysia 4,398 1.95%
12 Nepal 4,318 1.91%
13 Thailand 3,344 1.48%
14 Irish Republic 3,330 1.47%
15 United States of America 3,304 1.46%
16 Iran 3,253 1.44%
17 Korea, South 3,195 1.41%
18 Sri Lanka 3,153 1.40%
19 Afghanistan 2,944 1.30%
20 Bangladesh 2,457 1.09%

21 Indonesia 1,892 0.84%
22 Brazil 1,814 0.80%
23 Hong Kong 1,813 0.80%
24 Singapore 1,758 0.78%
25 Italy 1,701 0.75%
26 Canada 1,620 0.72%
27 France 1,533 0.68%
28 Myanmar (Burma) 1,472 0.65%
29 Germany 1,436 0.64%
30 Lebanon 1,377 0.61%

31 Taiwan 1,311 0.58%
32 Egypt 1,283 0.57%
33 Japan 1,199 0.53%
34 Colombia 1,056 0.47%
35 Zimbabwe 1,056 0.47%
36 Fiji 1,035 0.46%
37 United Arab Emirates 943 0.42%
38 Samoa 922 0.41%
39 Kenya 797 0.35%
40 Russian Federation 771 0.34%

41 Cambodia 725 0.32%
42 Ethiopia 710 0.31%
43 Nigeria 695 0.31%
44 Turkey 634 0.28%
45 Poland 618 0.27%
46 Netherlands, The 587 0.26%
47 Saudi Arabia 586 0.26%
48 Jordan 486 0.22%
49 Mauritius 469 0.21%
50 Spain 448 0.20%

Permanent additions by country of birth: 225,941

Source: Department of Home Affairs (Australia)

...and now it's off to the current largest city of Australia -- Sydney.


Image Source: furnishedproperty.com.au

Top 50 Non-Australian countries or places of birth

Greater Sydney, Australia 2016

1 China, People's Republic of 224,685
2 United Kingdom 179,844
3 India (Bhārat) 130,573
4 New Zealand (Aotearoa) 86,526
5 Vietnam (Việt Nam), Socialist Republic of 81,045
6 Philippines (Pilipinas), Republic of the 75,480
7 Lebanese Republic (Lebanon) 55,979
8 Korea, Republic of (South) 49,508
9 China, Hong Kong (Special Administrative Region) 40,577
10 Italy (Italia) 40,492

11 Iraq 39,237
12 South Africa, Republic of 35,313
13 Fiji Islands 31,510
14 Nepal 30,424
15 Indonesia 29,989
16 Malaysia 28,464
17 Greece (Hellenic Republic) 27,005
18 Sri Lanka 26,568
19 Thailand 23,224
20 Bangladesh 22,993

21 United States of America 22,846
22 Pakistan 22,841
23 Iran, Islamic Republic of 21,739
24 Ireland, Republic of (Éire) 19,763
25 Germany (Deutschland) 18,500
26 Egypt, Arab Republic of 18,442
27 Croatia (Hrvatska) 13,120
28 Japan 12,490
29 Malta 12,316
30 Afghanistan, Islamic Republic of 12,250

31 Cambodia (Kampuchea) 12,037
32 Taiwan 11,954
33 Turkey (Türkiye) 11,644
34 Singapore 11,529
35 Chile 11,510
36 Brasil 11,431
37 Poland (Polska) 11,326
38 Macedonia (Makedonija), The former Yugoslav Republic of 11,089
39 France 9,683
40 Canada 9,586

41 Netherlands (Nederland) 9,482
42 Syrian Arab Republic (Syria) 8,613
43 Samoa, Independent State of 8,309
44 Russian Federation (Russia) 6,988
45 Portugal 6,810
46 Colombia 6,359
47 Bosnia and Herzegovina 6,298
48 Myanmar (Burma) 6,119
49 Serbia (Srbija) 6,075
50 Cyprus 5,712

Total Foreign-born Population (excl. at sea, not stated, etc): 1,769,626
Metropolitan Area Population: 4,823,957

Sydney may very well have the largest population of people born in Lebanon outside of the Middle East/West Asia. The metro area also has the 2nd largest population born in Fiji, New Zealand and among the largest from Malta. It may also have the largest population born in Nepal of any metropolitan area outside of Asia and the Middle East (think laborers in UAE, Saudi Arabia, etc.).

Besides those already mentioned -- Sydney has the largest population of people born in mainland China, Vietnam, South Korea, Iraq, Philippines, Brazil, Chile, Colombia, Portugal and Egypt (among others) of any metro area in Australia.

Top 50 Most common languages spoken at home (non-English)

Greater Sydney, Australia 2016

1 Mandarin 228,985
2 Arabic 194,049
3 Cantonese 138,818
4 Vietnamese 99,301
5 Greek 76,201
6 Hindi 64,101
7 Italian 62,796
8 Filipino/Tagalog 62,080
9 Korean 57,789
10 Spanish 56,929

11 Persian/Dari 33,995
12 Nepali 32,535
13 Bengali 30,197
14 Assyrian/Aramaic 29,556
15 Indonesian 28,663
16 Punjabi 28,495
17 Tamil 28,431
18 Urdu 28,064
19 Thai 21,652
20 Portuguese 20,460

21 French 20,057
22 Turkish 19,838
23 Macedonian 18,958
24 Croatian 18,567
25 Serbian 18,544
26 Gujarati 17,729
27 Russian 17,497
28 German 15,994
29 Samoan 15,427
30 Japanese 15,241

31 Polish 12,060
32 Telugu 11,719
33 Khmer 11,351
34 Maltese 11,119
35 Malayalam 10,745
36 Sinhalese 9,996
37 Tongan 9,415
38 Armenian 7,755
39 Min Nan (incl.Hokkien) 7,005
40 Chinese, nfd 6,323

41 Dutch 5,888
42 Marathi 5,756
43 Hungarian 5,574
44 Afrikaans 5,390
45 Lao 5,113
46 Burmese 4,402
47 Fijian 3,795
48 Bosnian 3,627
49 Kannada 3,491
50 Hebrew 3,087

Next up is Melbourne -- the 2nd largest metro area in Australia (for now).


Image Source: melcorp.com.au

Top 50 Non-Australian countries or places of birth

Greater Melbourne, Australia 2016

1 United Kingdom 162,649
2 India (Bhārat) 161,078
3 China, People's Republic of 155,998
4 Vietnam (Việt Nam), Socialist Republic of 79,054
5 New Zealand (Aotearoa) 78,906
6 Italy (Italia) 63,332
7 Sri Lanka 54,030
8 Malaysia 47,642
9 Greece (Hellenic Republic) 45,618
10 Philippines (Pilipinas), Republic of the 45,157

11 South Africa, Republic of 24,168
12 China, Hong Kong (Special Administrative Region) 20,840
13 Germany (Deutschland) 20,211
14 Pakistan 20,033
15 Iraq 17,686
16 Indonesia 16,998
17 United States of America 16,765
18 Macedonia (Makedonija), The former Yugoslav Republic of 16,747
19 Lebanese Republic (Lebanon) 16,394
20 Malta 16,266

21 Afghanistan, Islamic Republic of 16,261
22 Iran, Islamic Republic of 15,731
23 Singapore 15,349
24 Turkey (Türkiye) 14,861
25 Korea, Republic of (South) 14,074
26 Thailand 13,909
27 Poland (Polska) 13,581
28 Ireland, Republic of (Éire) 13,329
29 Cambodia (Kampuchea) 13,259
30 Croatia (Hrvatska) 13,193

31 Egypt, Arab Republic of 12,683
32 Netherlands (Nederland) 12,619
33 Mauritius (Maurice) 11,365
34 Fiji Islands 10,089
35 Myanmar (Burma) 9,883
36 Nepal 8,880
37 Taiwan 8,606
38 Bosnia and Herzegovina 7,897
39 Japan 7,872
40 Canada 7,519

41 Bangladesh 7,402
42 Cyprus 7,255
43 Chile 7,137
44 Serbia (Srbija) 6,640
45 France 6,377
46 Ethiopia 6,172
47 Russian Federation (Russia) 5,995
48 Samoa, Independent State of 5,911
49 Sudan 5,222
50 Colombia 5,193

Total Foreign-born Population (excl. at sea, not stated, etc): 1,515,614
Metropolitan Area Population: 4,485,212

Melbourne may very well have the largest population born in Malta of any other metro area outside of Malta. Melbourne also has the largest population born in India, Italy, Malaysia, Sri Lanka, Greece, Afghanistan, Macedonia, Cambodia, Cyprus, Sudan and Ethiopia of any other metro in Australia.

Top 50 Most common languages spoken at home (non-English)

Greater Melbourne, Australia 2016

1 Mandarin 184,977
2 Greek 107,386
3 Italian 101,849
4 Vietnamese 101,388
5 Cantonese 76,283
6 Arabic 76,273
7 Punjabi 52,767
8 Hindi 49,446
9 Filipino/Tagalog 36,575
10 Sinhalese 36,279

11 Persian/Dari 34,768
12 Spanish 33,664
13 Turkish 30,306
14 Macedonian 28,035
15 Tamil 24,866
16 Urdu 22,399
17 French 17,598
18 Croatian 17,474
19 Russian 16,984
20 German 16,150

21 Indonesian 16,017
22 Maltese 15,954
23 Serbian 15,779
24 Assyrian/Aramaic 15,300
25 Malayalam 14,976
26 Korean 14,844
27 Gujarati 14,456
28 Khmer 14,379
29 Polish 14,037
30 Telugu 12,645

31 Samoan 11,195
32 Bengali 10,458
33 Japanese 10,418
34 Thai 10,392
35 Nepali 9,763
36 Somali 7,396
37 Portuguese 6,864
38 Chinese, nfd 6,703
39 Dutch 6,330
40 Albanian 6,267

41 Hungarian 5,993
42 Min Nan (incl.Hokkien) 5,669
43 Bosnian 5,598
44 Hakka 5,445
45 Hebrew 5,119
46 Romanian 4,893
47 Afrikaans 4,661
48 Dinka 4,567
49 Malay 4,501
50 Pashto 4,486

and now for the 3rd largest metropolitan area in Australia -- Brisbane.


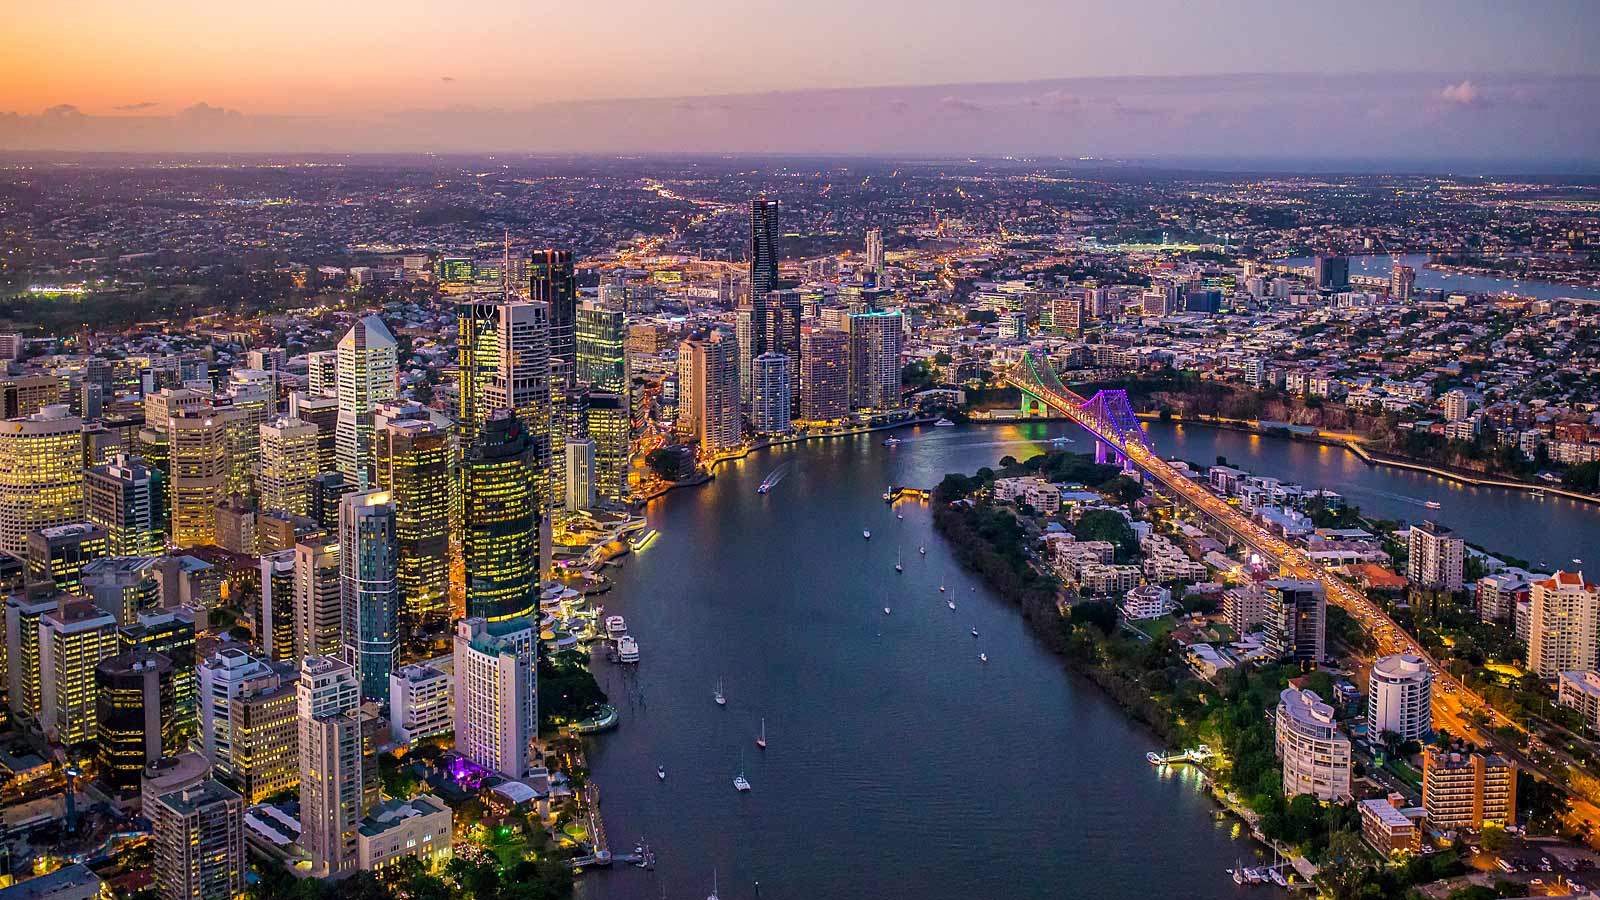
Image Source: brisbane.qld.gov.au

Top 50 Non-Australian countries or places of birth

Greater Brisbane, Australia 2016

1 United Kingdom 107,651
2 New Zealand (Aotearoa) 106,053
3 China, People's Republic of 36,175
4 India (Bhārat) 35,335
5 South Africa, Republic of 22,068
6 Philippines (Pilipinas), Republic of the 20,797
7 Vietnam (Việt Nam), Socialist Republic of 16,731
8 Korea, Republic of (South) 12,202
9 Taiwan 11,976
10 Malaysia 10,765

11 Fiji Islands 9,470
12 Germany (Deutschland) 9,149
13 United States of America 8,919
14 Papua New Guinea 8,351
15 China, Hong Kong (Special Administrative Region) 8,131
16 Sri Lanka 7,087
17 Samoa, Independent State of 7,081
18 Ireland, Republic of (Éire) 6,864
19 Netherlands (Nederland) 6,579
20 Italy (Italia) 6,357

21 Thailand 5,436
22 Canada 5,164
23 Iran, Islamic Republic of 5,065
24 Japan 5,053
25 Singapore 4,774
26 Zimbabwe 4,659
27 Indonesia 4,648
28 Pakistan 3,504
29 Colombia 3,460
30 Brasil 3,440

31 France 3,089
32 Nepal 3,078
33 Poland (Polska) 2,977
34 Afghanistan, Islamic Republic of 2,875
35 Myanmar (Burma) 2,470
36 Bosnia and Herzegovina 2,251
37 Greece (Hellenic Republic) 2,234
38 Iraq 2,015
39 El Salvador 1,993
40 Croatia (Hrvatska) 1,939

41 Bangladesh 1,899
42 Hungary (Magyarország) 1,846
43 Sudan 1,839
44 Romania (România) 1,703
45 Russian Federation (Russia) 1,639
46 Kenya 1,627
47 Cambodia (Kampuchea) 1,564
48 Spain (España) 1,485
49 Chile 1,481
50 Finland (Suomi) 1,382

Total Foreign-born Population (excl. at sea, not stated, etc): 591,453
Metropolitan Area Population: 2,270,813

Brisbane has the largest population of people born in New Zealand than another metro outside of NZ.

Top 50 Most common languages spoken at home (non-English)

Greater Brisbane, Australia 2016

1 Mandarin 53,492
2 Vietnamese 22,573
3 Cantonese 19,624
4 Filipino/Tagalog 15,221
5 Spanish 14,807
6 Hindi 14,560
7 Samoan 13,820
8 Korean 13,213
9 Punjabi 12,982
10 Italian 10,015

11 Arabic 9,884
12 Persian/Dari 8,450
13 Greek 7,557
14 German 7,555
15 Japanese 6,784
16 French 6,393
17 Afrikaans 6,246
18 Malayalam 4,897
19 Portuguese 4,669
20 Gujarati 4,571

21 Sinhalese 4,424
22 Thai 4,173
23 Tamil 4,095
24 Urdu 3,866
25 Russian 3,672
26 Indonesian 3,663
27 Dutch 3,529
28 Polish 3,338
29 Nepali 3,330
30 Serbian 3,296

31 Maori (New Zealand) 2,595
32 Telugu 2,577
33 Bengali 2,565
34 Tongan 2,408
35 Croatian 2,282
36 Somali 2,143
37 Hungarian 2,083
38 Khmer 2,069
39 Bosnian 1,788
40 Romanian 1,741

41 Chinese, nfd 1,719
42 Swahili 1,564
43 Malay 1,445
44 Auslan 1,424
45 Dinka 1,265
46 Karen 1,252
47 Finnish 1,240
48 Turkish 1,199
49 Min Nan (incl.Hokkien) 1,054
50 Fijian 983

It's now time for the fourth largest in Australia -- Perth!


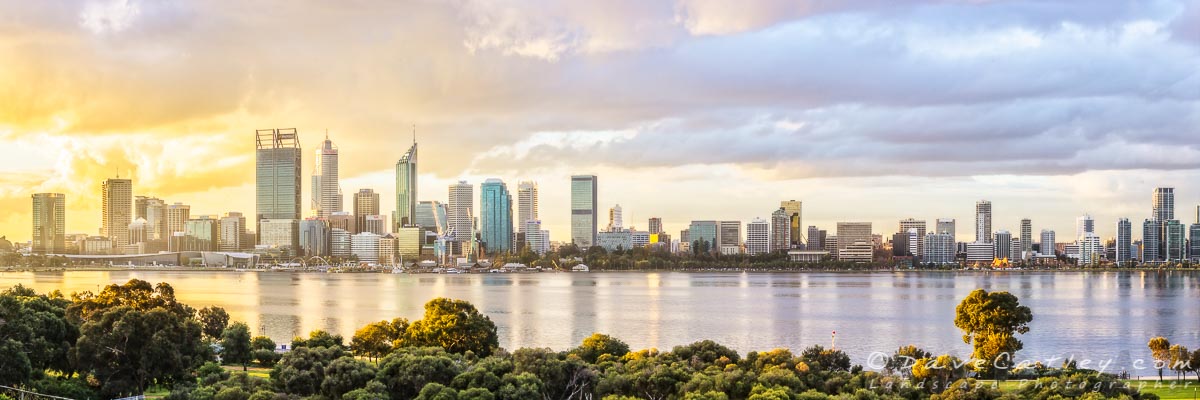
Image Source: madcat.com.au

Top 50 Non-Australian countries or places of birth

Greater Perth, Australia 2016

1 United Kingdom 200,565
2 New Zealand (Aotearoa) 61,326
3 India (Bhārat) 46,667
4 South Africa, Republic of 35,262
5 Malaysia 28,224
6 China, People's Republic of 25,911
7 Philippines (Pilipinas), Republic of the 24,624
8 Italy (Italia) 17,461
9 Ireland, Republic of (Éire) 16,115
10 Vietnam (Việt Nam), Socialist Republic of 15,131

11 Singapore 14,465
12 Indonesia 10,569
13 Zimbabwe 9,684
14 Germany (Deutschland) 8,675
15 Myanmar (Burma) 8,279
16 United States of America 7,885
17 Sri Lanka 7,286
18 Netherlands (Nederland) 7,285
19 Thailand 6,584
20 Korea, Republic of (South) 6,310

21 China, Hong Kong (Special Administrative Region) 5,839
22 Iran, Islamic Republic of 5,593
23 Pakistan 5,133
24 Poland (Polska) 5,129
25 Kenya 5,009
26 Afghanistan, Islamic Republic of 4,784
27 Canada 4,621
28 Mauritius (Maurice) 4,431
29 Croatia (Hrvatska) 4,300
30 Japan 3,961

31 Taiwan 3,938
32 Iraq 3,328
33 Brasil 3,286
34 France 3,183
35 Macedonia (Makedonija), The former Yugoslav Republic of 2,952
36 Bosnia and Herzegovina 2,591
37 Nepal 2,483
38 Bangladesh 2,375
39 Portugal 2,357
40 Greece (Hellenic Republic) 2,177

41 Sudan 2,140
42 Zambia 2,085
43 Egypt, Arab Republic of 2,071
44 Romania (România) 1,668
45 Russian Federation (Russia) 1,632
46 Colombia 1,626
47 Ethiopia 1,573
48 Serbia (Srbija) 1,570
49 Switzerland (Swiss Confederation) 1,528
50 Chile 1,504

Total Foreign-born Population (excl. at sea, not stated, etc): 701,365
Metropolitan Area Population: 1,943,874

Perth has the largest largest population that was born in the United Kingdom of any metro in the world outside of the UK. Perth also has the largest population that was born in Zimbabwe, Kenya and Zambia in Australia.

Top 50 Most common languages spoken at home (non-English)

Greater Perth, Australia 2016

1 Mandarin 45,658
2 Italian 26,759
3 Filipino/Tagalog 20,385
4 Vietnamese 19,396
5 Cantonese 18,830
6 Arabic 13,733
7 Punjabi 11,782
8 Persian/Dari 11,554
9 Afrikaans 11,393
10 Hindi 10,166

11 Indonesian 10,119
12 Spanish 9,661
13 French 8,566
14 German 7,562
15 Gujarati 7,178
16 Malayalam 6,877
17 Portuguese 6,633
18 Korean 6,630
19 Tamil 6,571
20 Macedonian 5,632

21 Polish 5,501
22 Japanese 5,403
23 Thai 5,353
24 Croatian 5,282
25 Urdu 5,099
26 Serbian 4,890
27 Malay 4,869
28 Burmese 4,728
29 Sinhalese 4,621
30 Greek 4,536

31 Dutch 4,224
32 Bengali 3,071
33 Russian 2,973
34 Nepali 2,692
35 Shona 2,652
36 Somali 2,513
37 Min Nan (incl.Hokkien) 2,440
38 Swahili 2,240
39 Maori (New Zealand) 2,215
40 Telugu 2,041

41 Bosnian 1,844
42 Karen 1,798
43 Romanian 1,761
44 Turkish 1,668
45 Dinka 1,585
46 Khmer 1,466
47 Hungarian 1,157
48 Chinese, nfd 1,124
49 Marathi 982
50 Amharic 879

Moving on to Adelaide!


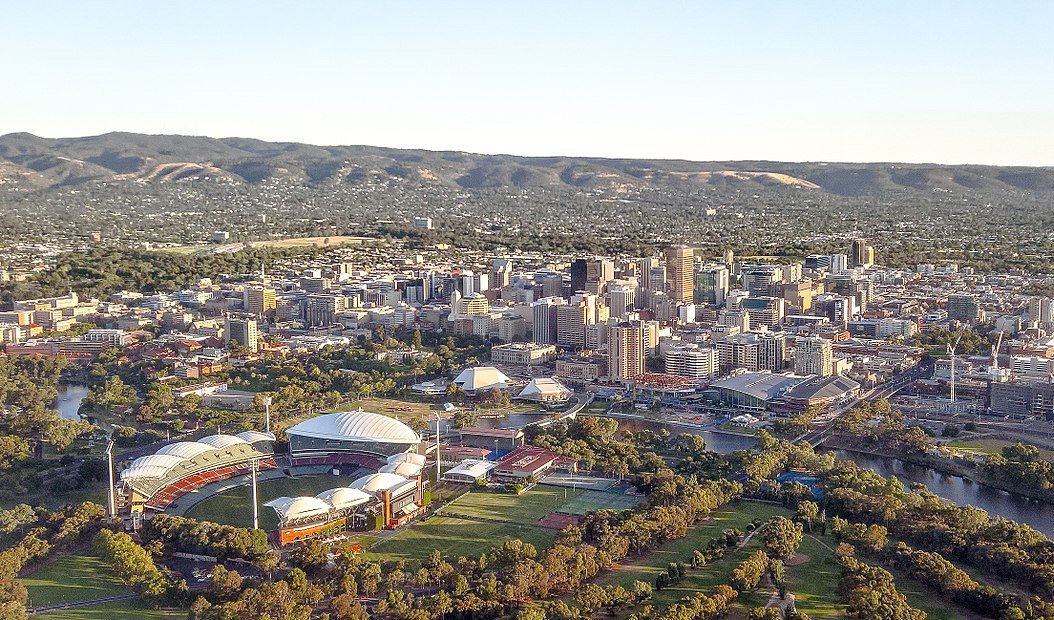
Image Source: australiangeographic.com.au

Top 50 Non-Australian countries or places of birth

Greater Adelaide, Australia 2016

1 United Kingdom 95,317
2 India (Bhārat) 26,270
3 China, People's Republic of 23,919
4 Italy (Italia) 17,398
5 Vietnam (Việt Nam), Socialist Republic of 13,932
6 Philippines (Pilipinas), Republic of the 10,204
7 New Zealand (Aotearoa) 9,882
8 Germany (Deutschland) 8,242
9 Greece (Hellenic Republic) 8,022
10 Malaysia 7,465

11 Afghanistan, Islamic Republic of 5,847
12 South Africa, Republic of 5,587
13 Netherlands (Nederland) 4,863
14 Poland (Polska) 4,748
15 Iran, Islamic Republic of 4,456
16 United States of America 3,760
17 Korea, Republic of (South) 3,522
18 Sri Lanka 3,520
19 China, Hong Kong (Special Administrative Region) 3,445
20 Pakistan 3,262

21 Cambodia (Kampuchea) 3,128
22 Ireland, Republic of (Éire) 2,895
23 Nepal 2,821
24 Croatia (Hrvatska) 2,533
25 Thailand 2,417
26 Singapore 2,403
27 Indonesia 1,986
28 Canada 1,948
29 Bosnia and Herzegovina 1,920
30 Bangladesh 1,848

31 Kenya 1,595
32 Lebanese Republic (Lebanon) 1,495
33 Iraq 1,459
34 Japan 1,418
35 Egypt, Arab Republic of 1,410
36 Bhutan (Druk-yul) 1,407
37 Myanmar (Burma) 1,349
38 Taiwan 1,299
39 Serbia (Srbija) 1,294
40 Malta 1,283

41 Russian Federation (Russia) 1,191
42 Saudi Arabia 1,176
43 Zimbabwe 1,173
44 France 1,150
45 Cyprus 1,127
46 Hungary (Magyarország) 1,117
47 Austria (Österreich) 1,115
48 Fiji Islands 1,051
49 Sudan 956
50 Romania (România) 913

Total Foreign-born Population (excl. at sea, not stated, etc): 340,280
Metropolitan Area Population: 1,295,676

Top 50 Most common languages spoken at home (non-English)

Greater Adelaide, Australia 2016

1 Italian 27,595
2 Mandarin 27,591
3 Greek 21,464
4 Vietnamese 18,563
5 Persian/Dari 11,452
6 Cantonese 9,459
7 Arabic 9,092
8 Punjabi 8,498
9 Filipino/Tagalog 7,675
10 Hindi 7,054

11 Polish 5,493
12 Spanish 5,402
13 German 5,387
14 Nepali 4,466
15 Gujarati 4,285
16 Khmer 4,187
17 Serbian 4,080
18 Malayalam 3,562
19 Korean 3,487
20 Russian 3,195

21 Urdu 2,805
22 Croatian 2,763
23 Tamil 2,536
24 Sinhalese 2,491
25 French 2,407
26 Bengali 2,273
27 Dutch 2,098
28 Japanese 2,027
29 Afrikaans 1,837
30 Swahili 1,810

31 Thai 1,717
32 Indonesian 1,712
33 Dinka 1,696
34 Portuguese 1,498
35 Bosnian 1,387
36 Hungarian 1,289
37 Telugu 1,265
38 Chinese, nfd 1,206
39 Ukrainian 1,065
40 Malay 973

41 Romanian 873
42 Maltese 805
43 Min Nan (incl.Hokkien) 800
44 Auslan 755
45 Kurdish 747
46 Australian Indigenous Languages 705
47 Marathi 703
48 Lao 667
49 Macedonian 614
50 Pashto 574


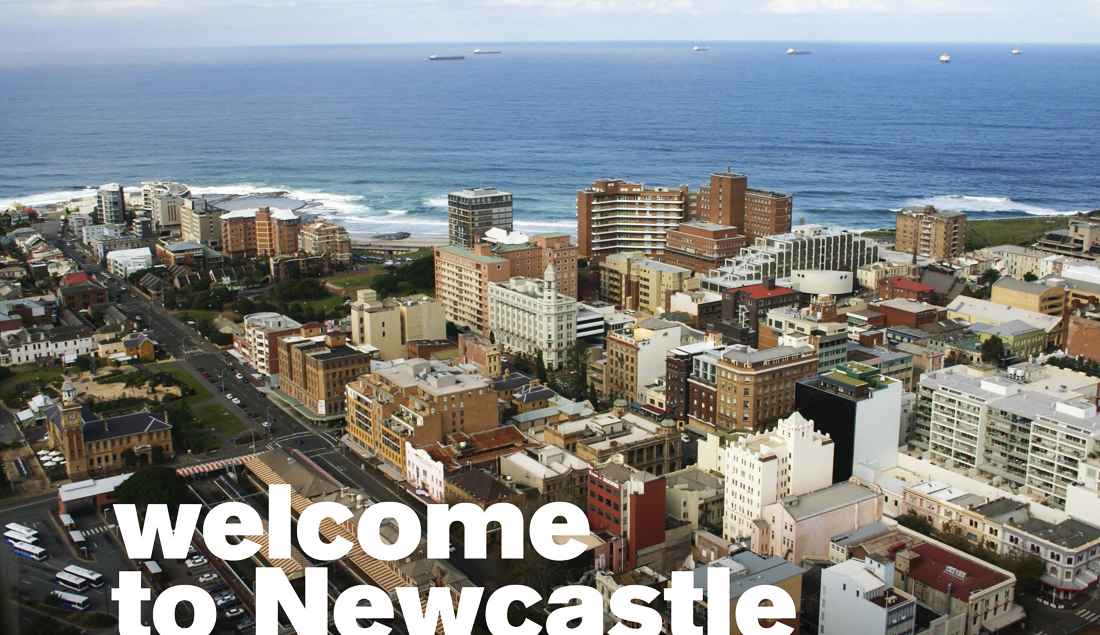
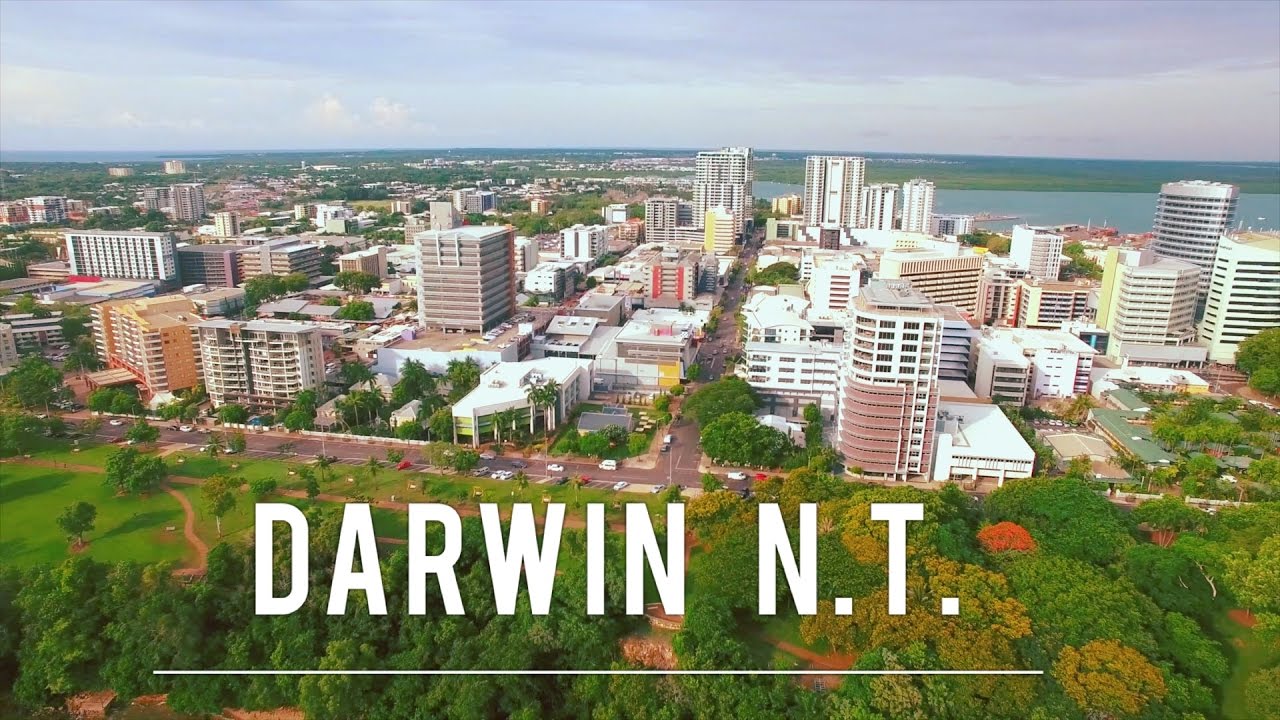
There is much more to come! So stay tuned, we are just getting started.

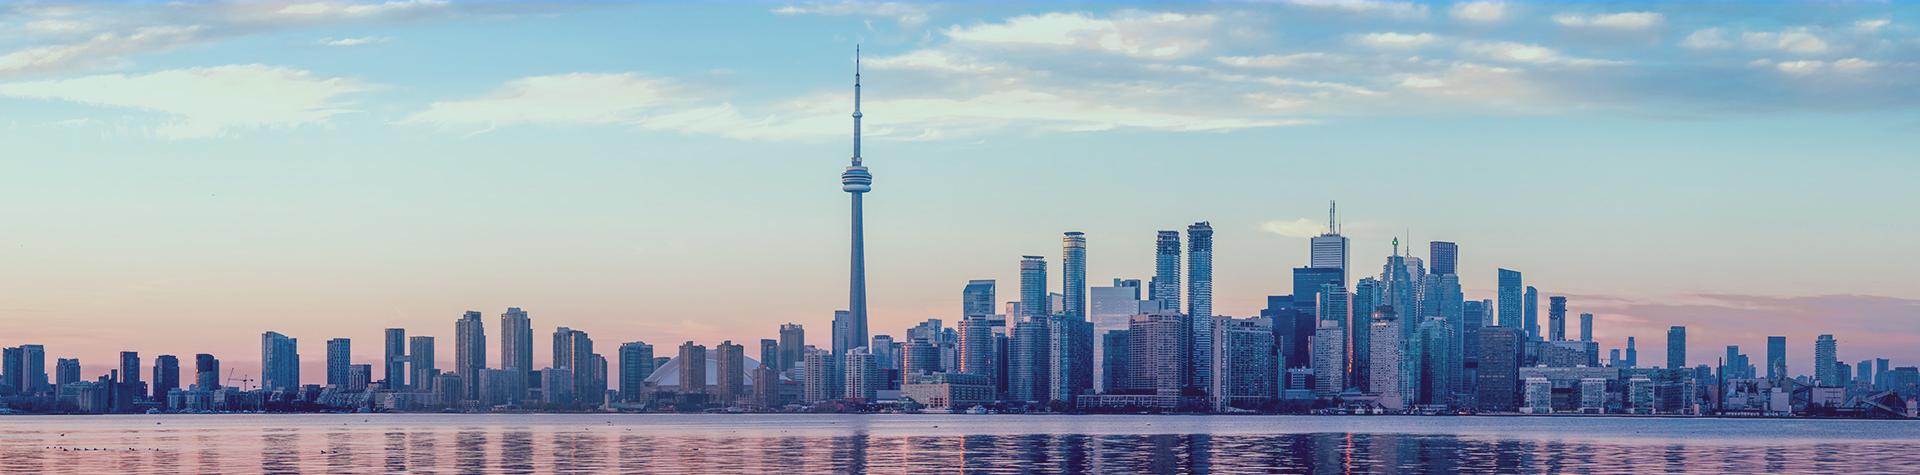
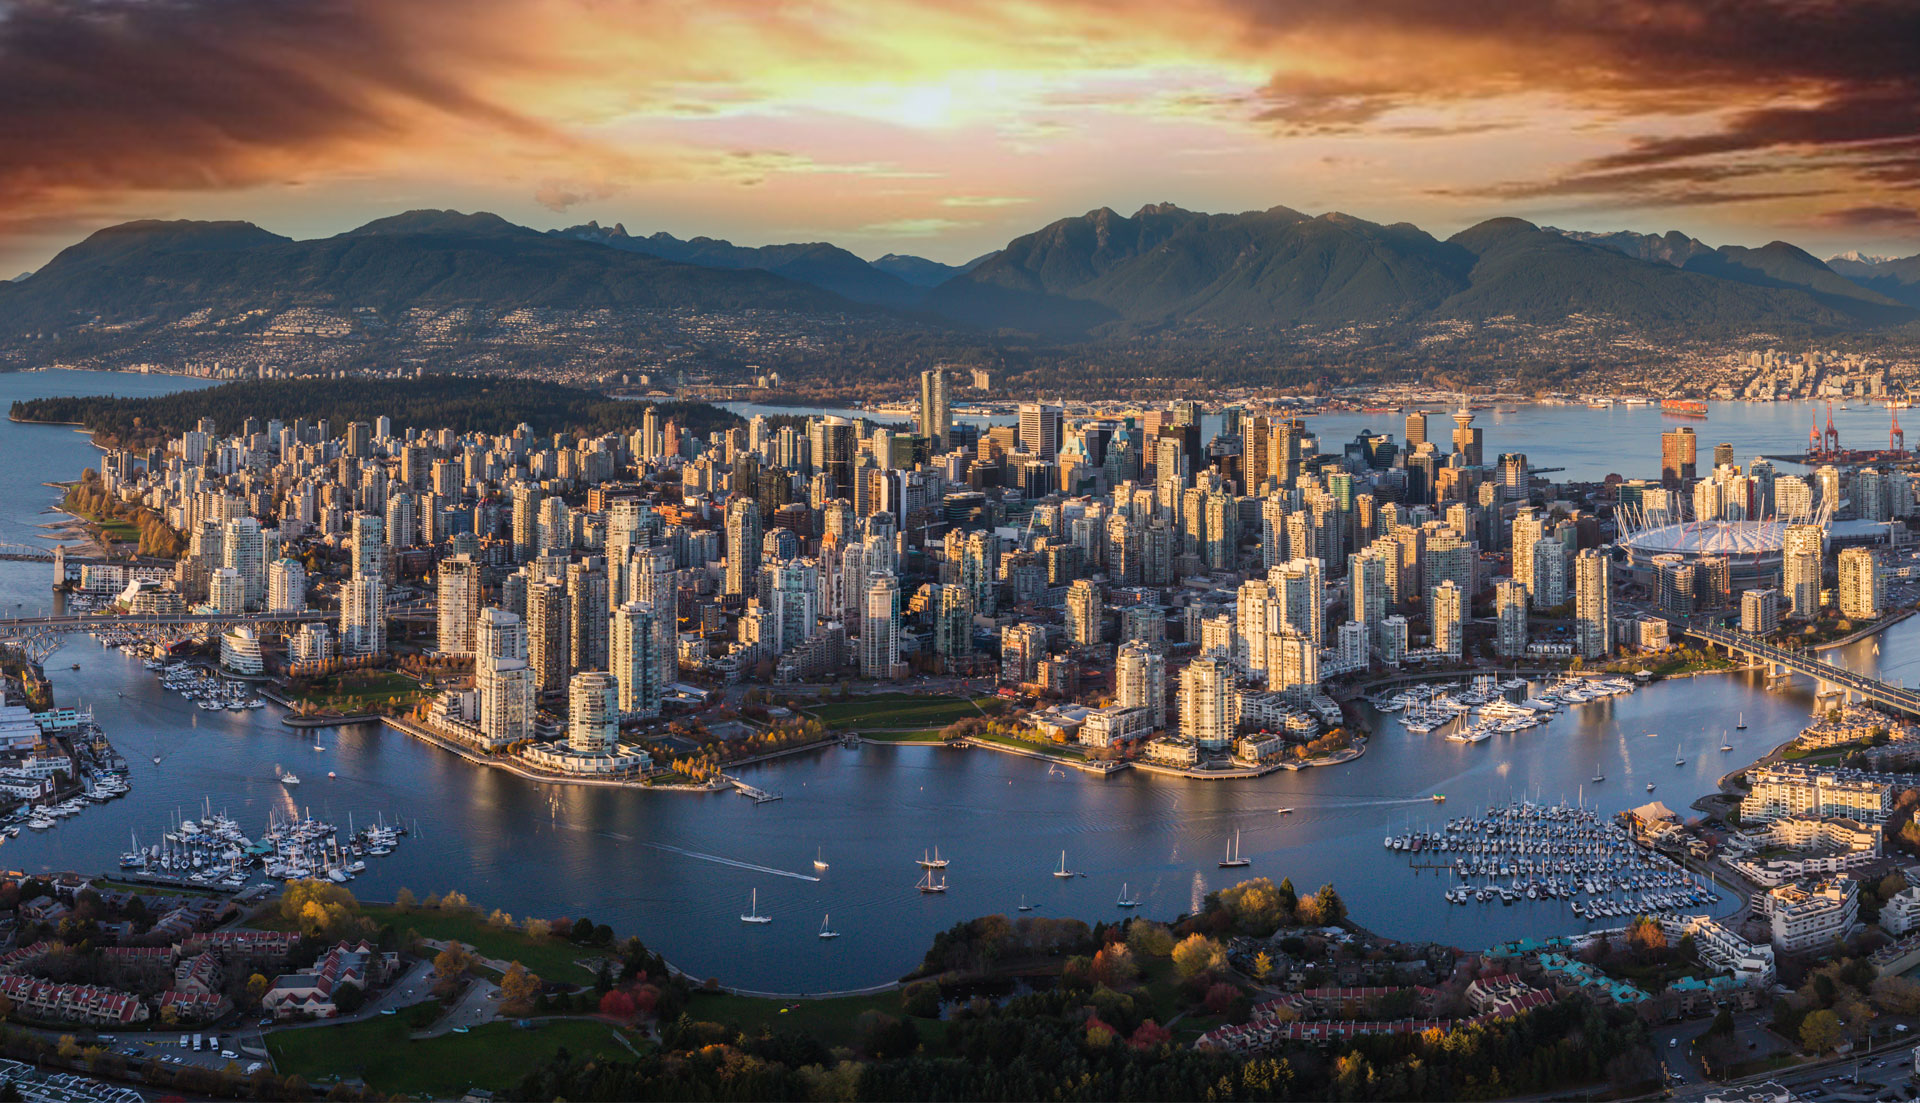
We will be exploring at least 5 more cities in Australia before moving on to Canada, United Kingdom, France, Norway, Italy, Jordan and lots of others.

This will be an ongoing thread.

Last edited by Urbanguy; Sep 24, 2018 at 5:35 AM.
Reply With Quote
     
     
  #2  
Old Posted Sep 24, 2018, 10:42 AM
giallo's Avatar
giallo giallo is offline
be nice to the crackheads
 
Join Date: Apr 2002
Location: Vancouver
Posts: 11,539
Dang. Great start to the thread. I love stuff like this. Thanks, Urbanguy!
Reply With Quote
     
     
  #3  
Old Posted Sep 24, 2018, 2:35 PM
Urbanguy's Avatar
Urbanguy Urbanguy is offline
Go Beavs! Go Niners!
 
Join Date: Dec 2001
Location: Portland | Honolulu
Posts: 6,209
You're welcome! I'll try to add more tonight.

At least in the case of Australia -- it has come a long way in a short amount of time as far its immigrant source diversity is concerned. Like the US and Canada earlier in their histories of immigration -- European countries were the primary and major sources of immigrants and now they're coming from all parts of the globe. Another interesting thing about Australia is that many of their immigrants and descendants, even those that have been there longer (e.g., Italians, Greeks, etc.) -- have been able to retain their native languages more so than many other places.

You may also notice a common theme of immigrants from places like Chile, Argentina, El Salvador, Colombia -- not only in Australia (mainly because people don't often associate it as having a Latino population) but other parts of the world as many of the first settlers came as Refugees followed by Family Reunification. Australia started accepting refugees from Chile starting in the 1970s to some of the more recent from places like Sudan, Syria and Iraq.

Then there are others like those from places like Brazil, Nigeria and so on that you'll see appear all over the globe -- those are often economic-related.

..and although, there's often debates about which city is more diverse than others, one thing is clear -- is that it has expanded beyond the most well-known immigrant hubs like New York City, London, Toronto, Los Angeles and Paris.
Reply With Quote
     
     
  #4  
Old Posted Sep 24, 2018, 2:42 PM
sopas ej's Avatar
sopas ej sopas ej is offline
Registered User
 
Join Date: Jul 2007
Location: South Pasadena, California
Posts: 6,863
Quote:
Originally Posted by Urbanguy View Post
Another interesting thing about Australia is that many of their immigrants and descendants, even those that have been there longer (e.g., Italians, Greeks, etc.) -- have been able to retain their native languages more so than many other places.
Also interestingly, Australia is one of only 8 countries that have no official language. The rest are the UK, the US (though 31 states have official languages), Costa Rica, Pakistan, Eritrea, Ethiopia, and Somalia.
__________________
"I guess the only time people think about injustice is when it happens to them."

~ Charles Bukowski
Reply With Quote
     
     
  #5  
Old Posted Sep 24, 2018, 4:00 PM
Urbanguy's Avatar
Urbanguy Urbanguy is offline
Go Beavs! Go Niners!
 
Join Date: Dec 2001
Location: Portland | Honolulu
Posts: 6,209
^Even though Australia has its fair share of racism especially towards Aborigines, certain immigrant groups and controversial policies towards Asylum seekers that travel by boat it has really become a popular destination.

I also wonder if the immigrants there and their descendants are slow to assimilate being that many retain their native languages in a predominately English-speaking country.
Reply With Quote
     
     
  #6  
Old Posted Sep 24, 2018, 5:34 PM
Acajack's Avatar
Acajack Acajack is offline
Unapologetic Occidental
 
Join Date: Aug 2006
Location: Province 2, Canadian Empire
Posts: 68,143
Quote:
Originally Posted by Urbanguy View Post

I also wonder if the immigrants there and their descendants are slow to assimilate being that many retain their native languages in a predominately English-speaking country.
I'd like to hear more about this. I am not really challenging you - on the one hand I've heard this before about Australia, but on the other I've been there and am quite familiar with Australian society, and didn't find it was significantly different from most of Anglo North America in terms of the overall immigrant experience.

So... I'm curious.
__________________
The Last Word.
Reply With Quote
     
     
  #7  
Old Posted Sep 24, 2018, 5:46 PM
Sun Belt Sun Belt is offline
BANNED
 
Join Date: Sep 2017
Location: The Envy of the World
Posts: 4,926
Wow, lots of information!

If I lived in Australia I'd like to live in Brisbane or Perth.
Reply With Quote
     
     
  #8  
Old Posted Sep 24, 2018, 7:50 PM
Urbanguy's Avatar
Urbanguy Urbanguy is offline
Go Beavs! Go Niners!
 
Join Date: Dec 2001
Location: Portland | Honolulu
Posts: 6,209
Quote:
Originally Posted by Acajack View Post
I'd like to hear more about this. I am not really challenging you - on the one hand I've heard this before about Australia, but on the other I've been there and am quite familiar with Australian society, and didn't find it was significantly different from most of Anglo North America in terms of the overall immigrant experience.

So... I'm curious.
Sure, I'll give you a couple of examples as the numbers seem to indicate this quite well and this off of a couple of the earliest set of immigrants....

Australia

1. population born in Italy in 2016: 174,042
2. population that speaks Italian at home in 2016: 271,602

The population speaking Italian at home is nearly a 100,000 more than the population of those that were born in Italy -- which clearly indicates that it is being passed on.

For the sake of comparison by 1881 both Canada & Australia had similar amounts of Italians -- Canada nearly 2,000 (source: Italian Canadians & Australia roughly 1,700 to 2,100 (source: Italian Migration to Australia). Both countries experienced large scale migration from Italy following WWII until at least the 1970s.

Using similar metrics for...

Canada

1. population born in Italy in 2016: 242,255
2. population that speaks Italian at home in 2016: 115,415 (spoken most often at home) or another figure of language spoken at home: 318,245 (single & multiple responses).

Source: Statscan, Census 2016

Notice that the rate is much higher in Australia even if you include the largest figure in Canada using single & multiple responses?

Let's take a look at the Greek's...

Australia

1. population born in Greece in 2016: 93,743 + Cyprus 16,929 = 110,672
2. population that speaks Greek at home in 2016: 237,583

Canada

1. population born in Greece in 2016: 65,225 + Cyprus 4,200 = 69,425
2. population that speaks Greek at home in 2016: 44,545 (spoken most often at home) or another figure of language spoken at home: 114,915 (single & multiple responses).

The native language retention is still at a higher rate in Australia even when you throw in Cyprus (which has both Greeks and Turks) or not.

Hope this helps.
Reply With Quote
     
     
  #9  
Old Posted Sep 24, 2018, 10:38 PM
Urbanguy's Avatar
Urbanguy Urbanguy is offline
Go Beavs! Go Niners!
 
Join Date: Dec 2001
Location: Portland | Honolulu
Posts: 6,209
Now it's off to the smaller metros and cities in Australia -- starting with the Gold Coast in Queensland!


Image Source: Mike Robertson@flickr.com

Top 50 Non-Australian countries or places of birth

Gold Coast City, Australia 2016

1 New Zealand (Aotearoa) 44,189
2 United Kingdom 33,802
3 China, People's Republic of 6,957
4 South Africa, Republic of 6,823
5 Japan 4,232
6 India (Bhārat) 4,144
7 Philippines (Pilipinas), Republic of the 4,075
8 Korea, Republic of (South) 3,164
9 Germany (Deutschland) 2,860
10 United States of America 2,508

11 Brasil 1,965
12 Canada 1,833
13 Netherlands (Nederland) 1,823
14 Italy (Italia) 1,682
15 Malaysia 1,668
16 Thailand 1,538
17 Taiwan 1,476
18 China, Hong Kong (Special Administrative Region) 1,451
19 Ireland, Republic of (Éire) 1,396
20 Serbia and Montenegro, former 1,107

21 Papua New Guinea 1,040
22 Poland (Polska) 976
23 Indonesia 961
24 Fiji Islands 927
25 Singapore 881
26 Zimbabwe 879
27 Croatia (Hrvatska) 871
28 France 870
29 Iran, Islamic Republic of 839
30 Vietnam (Việt Nam), Socialist Republic of 828

31 Bosnia and Herzegovina 786
32 Hungary (Magyarország) 760
33 Russian Federation (Russia) 755
34 Sri Lanka 632
35 Egypt, Arab Republic of 626
36 Nepal 568
37 Greece (Hellenic Republic) 544
38 Malta 507
39 Colombia 498
40 Austria (Österreich) 475

41 Pakistan 409
42 Spain (España) 404
43 Chile 399
44 Sweden 390
45 Turkey (Türkiye) 385
46 Switzerland (Swiss Confederation) 384
47 Romania (România) 381
48 Mauritius (Maurice) 355
49 Argentine Republic (Argentina) 353
50 Czech Republic (Česká Republika) 344

Total Foreign-born: 156,920
Total Population: 555,716

Then it's down to Tasmania and Hobart!


Image Source: buildaustralia.com.au

Top 50 Non-Australian countries or places of birth

Greater Hobart, Australia 2016

1 United Kingdom 9,412
2 China, People's Republic of 2,376
3 New Zealand (Aotearoa) 1,959
4 India (Bhārat) 1,260
5 Germany (Deutschland) 1,040
6 United States of America 859
7 South Africa, Republic of 820
8 Malaysia 811
9 Netherlands (Nederland) 783
10 Philippines (Pilipinas), Republic of the 714

11 Italy (Italia) 519
12 Nepal 498
13 Canada 426
14 Greece (Hellenic Republic) 399
15 Poland (Polska) 372
16 Korea, Republic of (South) 370
17 Thailand 370
18 Ireland, Republic of (Éire) 347
19 Singapore 344
20 Bhutan (Druk-yul) 319

21 Iran, Islamic Republic of 305
22 China, Hong Kong (Special Administrative Region) 298
23 Japan 270
24 Vietnam (Việt Nam), Socialist Republic of 253
25 Sudan 249
26 Pakistan 235
27 Ethiopia 211
28 France 207
29 Sri Lanka 197
30 Indonesia 172

31 Croatia (Hrvatska) 167
32 Afghanistan, Islamic Republic of 153
33 Papua New Guinea 151
34 Chile 142
35 Austria (Österreich) 139
36 Zimbabwe 139
37 Fiji Islands 131
38 Taiwan 131
39 Switzerland (Swiss Confederation) 130
40 Myanmar (Burma) 128

Total Foreign-born Population (excl. at sea, not stated, etc): 30,588
Metropolitan Area Population: 222,364

...time for Canberra -- Australia's Capital City


Image Source: sbs.com.au


Image Source: wikipedia.org

Top 50 Non-Australian countries or places of birth

Canberra Region, Australia 2016

1 United Kingdom 8,749
2 New Zealand (Aotearoa) 2,606
3 Germany (Deutschland) 1,261
4 India (Bhārat) 1,209
5 Philippines (Pilipinas), Republic of the 951
6 Netherlands (Nederland) 810
7 United States of America 803
8 Italy (Italia) 753
9 South Africa, Republic of 577
10 Macedonia (Makedonija), The former Yugoslav Republic of 563

11 China, People's Republic of 480
12 Ireland, Republic of (Éire) 392
13 Serbia and Montenegro, former 375
14 Canada 369
15 Croatia (Hrvatska) 366
16 Thailand 278
17 Greece (Hellenic Republic) 272
18 Malaysia 247
19 Austria (Österreich) 237
20 Fiji Islands 229

21 Poland (Polska) 222
22 Malta 217
23 Indonesia 216
24 Vietnam (Việt Nam), Socialist Republic of 201
25 Bangladesh 199
26 France 197
27 Nepal 189
28 Sri Lanka 183
29 Lebanese Republic (Lebanon) 179
30 Papua New Guinea 178

31 Korea, Republic of (South) 168
32 Finland (Suomi) 161
33 Hungary (Magyarország) 142
34 Pakistan 141
35 Zimbabwe 126
36 Switzerland (Swiss Confederation) 121
37 China, Hong Kong (Special Administrative Region) 119
38 Singapore 117
39 Chile 116
40 Egypt, Arab Republic of 103

Total Foreign-born: 27,249
Total Population: 218,602

off we go to Newcastle!


Image Source: newcastle.edu.au

Top 50 Non-Australian countries or places of birth

Newcastle City, Australia 2016

1 United Kingdom 4,050
2 China, People's Republic of 1,715
3 New Zealand (Aotearoa) 1,623
4 India (Bhārat) 1,158
5 Philippines (Pilipinas), Republic of the 812
6 Macedonia (Makedonija), The former Yugoslav Republic of 661
7 Italy (Italia) 652
8 Germany (Deutschland) 598
9 United States of America 588
10 Malaysia 432

11 South Africa, Republic of 431
12 Korea, Republic of (South) 402
13 Vietnam (Việt Nam), Socialist Republic of 392
14 Greece (Hellenic Republic) 370
15 Canada 322
16 Ireland, Republic of (Éire) 304
17 China, Hong Kong (Special Administrative Region) 280
18 Poland (Polska) 272
19 Thailand 267
20 Afghanistan, Islamic Republic of 256

21 Pakistan 249
22 Iran, Islamic Republic of 241
23 Netherlands (Nederland) 227
24 Sri Lanka 226
25 Saudi Arabia 207
26 Croatia (Hrvatska) 177
27 Singapore 174
28 Taiwan 169
29 Bangladesh 163
30 Zimbabwe 159

31 Bosnia and Herzegovina 145
32 Fiji Islands 134
33 Indonesia 130
34 Nigeria 121
35 Japan 119
36 France 116
37 Iraq 111
38 Papua New Guinea 107
39 Sudan 101
40 Nepal 100

Total Foreign-born: 21,580
Total Population: 155,381

...and last but not least is Darwin.


Image Source: whereisdannyblack@youtube & instagram

Top 50 Non-Australian countries or places of birth

Greater Darwin, Australia 2016

1 United Kingdom 5,066
2 Philippines (Pilipinas), Republic of the 4,963
3 New Zealand (Aotearoa) 2,896
4 India (Bhārat) 2,697
5 Greece (Hellenic Republic) 1,234
6 China, People's Republic of 1,057
7 Timor-Leste (East Timor), Democratic Republic of 1,008
8 Indonesia 1,002
9 Nepal 995
10 Ireland, Republic of (Éire) 869

11 Thailand 805
12 Vietnam (Việt Nam), Socialist Republic of 768
13 Germany (Deutschland) 643
14 Sri Lanka 635
15 Malaysia 619
16 South Africa, Republic of 618
17 Taiwan 479
18 United States of America 438
19 Papua New Guinea 437
20 Zimbabwe 420

21 Japan 393
22 Bangladesh 372
23 Italy (Italia) 364
24 Korea, Republic of (South) 321
25 Pakistan 312
26 Netherlands (Nederland) 282
27 France 273
28 Singapore 259
29 Canada 253
30 Fiji Islands 234

31 China, Hong Kong (Special Administrative Region) 228
32 Cambodia (Kampuchea) 187
33 Sudan 184
34 Myanmar (Burma) 175
35 Portugal 145
36 Nigeria 131
37 Iran, Islamic Republic of 129
38 Cyprus 118
39 Kenya 118
40 Congo (Zaire), Democratic Republic of the 109

Total Foreign-born Population (excl. at sea, not stated, etc): 34,885
Metropolitan Area Population: 136,798

Of course we cannot forget about the first Australians -- the Aboriginals in Australia!

"Aboriginals had the continent to themselves for 50,000 years. Today they make up less than 3 percent of the population, and their traditional lifestyle is disappearing. Almost. In the homelands the ancient ways live on."
*an excerpt from National Geographic that wrote a story about these first Australians.


Image Source: cdn.travelpulse.com

The total population of Aboriginals including Torres Straits Islanders was 649,171 in 2016 of that only 64,761 spoke their indigenous languages at home or at least proficiently. It is believed that there were nearly 400 aboriginal languages spoken at the time of first European contact -- that number has shrank considerably.

According to the Australian Census -- there were more than 150 Australian Indigenous languages spoken at home. Between 1991 and 2016, the proportion of Aboriginal and Torres Strait Islander peoples reporting English as their main language spoken at home increased from 79 per cent to 84 per cent. In contrast, the proportion of non-Indigenous people who spoke English at home decreased over the same period, from 84 per cent to 77 per cent.

Aboriginal: 590,056
Torres Strait Islander: 32,345
Both Aboriginal and Torres Strait Islander(a): 26,767


Click to see a MAP of the native lands of the various indigenous groups in OZ.

...Hopefully you all will enjoy this and for those from Australia, please feel free to share more about your homeland or city!
Reply With Quote
     
     
  #10  
Old Posted Sep 25, 2018, 1:41 AM
Urbanguy's Avatar
Urbanguy Urbanguy is offline
Go Beavs! Go Niners!
 
Join Date: Dec 2001
Location: Portland | Honolulu
Posts: 6,209
Just a mini throwback to 30 years ago....Australia's demographics looked a little like this...

Top places of overseas-born

Australia 1986

1 United Kingdom and Ireland 1,127,200
2 Italy 261,900
3 Yugoslavia 150,000
4 Greece 137,600
5 Other Countries 131,200
6 Germany 114,800
7 Other main English-speaking countries 99,900
8 Netherlands 95,100
9 Vietnam 83,000
10 India and Sri Lanka 70,300

11 Poland 67,700
12 China and Hong Kong 65,800
13 Lebanon 56,300
14 Malta 56,200
15 Malaysia 47,800
16 South America 46,700
17 Scandinavia 25,700
18 Spain 16,300
19 France 14,900
Overseas born: 3,247,400
Total Population: 16,018,350

Australia's native peoples:

Australia 1986

Aboriginal and Torres Strait Islander 227,645
Torres Strait Islander 26,884
Aboriginal 238,575
Indigenous Languages and Proficiency Age 5 years and over 43,499
Reply With Quote
     
     
  #11  
Old Posted Sep 25, 2018, 4:18 AM
Urbanguy's Avatar
Urbanguy Urbanguy is offline
Go Beavs! Go Niners!
 
Join Date: Dec 2001
Location: Portland | Honolulu
Posts: 6,209
Next up is Canada!

Capital: Ottawa
Country Population: 34,460,060 (2016)

This from wikipedia: "The history of Canada covers the period from the arrival of Paleo-Indians thousands of years ago to the present day. Prior to European colonization, the lands encompassing present-day Canada were inhabited for millennia by Indigenous peoples, with distinct trade networks, spiritual beliefs, and styles of social organization. Some of these older civilizations had long faded by the time of the first European arrivals and have been discovered through archaeological investigations."

"Starting in the late 15th century, French and British expeditions explored, colonized, and fought over various places within North America in what constitutes present-day Canada. The colony of New France was established in 1534 and was ceded to the United Kingdom in 1763 after the French defeat in the Seven Years' War. The now British Province of Quebec was divided into Upper and Lower Canada in 1791 and reunified in 1841. In 1867, the Province of Canada was joined with two other British colonies of New Brunswick and Nova Scotia through Confederation, forming a self-governing entity named Canada. The new dominion expanded by incorporating other parts of British North America, finishing with Newfoundland and Labrador in 1949."


Image Source: wikimedia.org

Top 50 Non-Canadian countries or places of birth

Canada 2016

1 India (Bhārat) 668,565
2 China, People's Republic of 649,260
3 Philippines (Pilipinas), Republic of the 588,305
4 United Kingdom 499,120
5 United States 253,715
6 Italy (Italia) 236,635
7 China, Hong Kong (Special Administrative Region) 208,935
8 Pakistan 202,255
9 Vietnam (Việt Nam), Socialist Republic of 169,250
10 Iran, Islamic Republic of 154,420

11 Poland (Polska) 146,470
12 Germany (Deutschland) 145,840
13 Portugal 139,450
14 Jamaica 138,345
15 Sri Lanka 131,995
16 Korea, Republic of (South) 123,305
17 France 105,570
18 Haïti 93,485
19 Romania (România) 90,310
20 Lebanese Republic (Lebanon) 88,740

21 Netherlands (Nederland) 88,475
22 Guyana 87,680
23 México (Estados Unidos Mexicanos) 80,590
24 Russian Federation (Russia) 78,685
25 Ukraine 73,030
26 Colombia 70,040
27 Morocco (Al Maghrib) 69,655
28 Iraq 68,490
29 Trinidad and Tobago 65,035
30 Algeria (Al Jaza'ir) 64,625

31 Egypt, Arab Republic of 64,620
32 Taiwan 63,770
33 Greece (Hellenic Republic) 62,715
34 Bangladesh 58,735
35 Syrian Arab Republic (Syria) 52,955
36 Afghanistan, Islamic Republic of 51,960
37 El Salvador 48,075
38 South Africa, Republic of 44,660
39 Nigeria 42,430
40 Croatia (Hrvatska) 40,040

41 Hungary 36,825
42 Bosnia and Herzegovina 36,135
43 Serbia (Srbija) 33,320
44 Ethiopia 32,790
45 Perú 29,615
46 Brasil 29,315
47 Ireland, Republic of (Éire) 28,320
48 Japan 27,245
49 Somalia 27,230
50 Kenya 27,150

Total Foreign-born: 7,540,830
Total Population: 34,460,060
Source: Immigration and Ethnocultural Diversity, Statistics Canada (Statscan), Census 2016

Canada has one of the largest populations of immigrants that were born in Sri Lanka (most likely 2nd if you exclude the Middle East & Asia), definitely the very largest in all of the America's.

Top 50 languages spoken most often at home (non-official) *These stats do include aboriginal languages, however.

Canada 2016

1 Mandarin 462,890
2 Cantonese 400,215
3 Punjabi (Panjabi) 349,140
4 Spanish 263,510
5 Arabic 223,540
6 Tagalog (Pilipino, Filipino) 213,790
7 Persian (Farsi) 143,020
8 Urdu 128,785
9 German 120,330
10 Russian 116,595

11 Italian 115,415
12 Korean 109,705
13 Vietnamese 104,245
14 Portuguese 98,710
15 Tamil 96,955
16 Polish 74,780
17 Gujarati 64,150
18 Hindi 55,515
19 Romanian 53,320
20 Bengali 47,350

21 Greek 44,545
22 Cree, n.o.s. (Aboriginal) 37,950
23 Serbian 31,750
24 Inuktitut (Aboriginal) 29,235
25 Ukrainian 28,250
26 Creole, n.o.s. 24,575
27 Chinese, n.o.s. 23,940
28 Somali (Cushitic) 22,890
29 Armenian 21,510
30 Japanese 19,780

31 Hungarian 19,485
32 Turkish 18,955
33 Croatian 16,775
34 Malayalam 15,440
35 Min Nan (Chaochow, Teochow, Fukien, Taiwanese) 13,970
36 Nepali 13,375
37 Albanian 13,135
38 Amharic 12,780
39 Bulgarian 11,985
40 Khmer (Cambodian) 10,885

41 Pashto 10,590
42 Assyrian Neo-Aramaic 10,510
43 Tigrigna 10,205
44 Dutch 9,560
45 Ilocano 9,125
46 Montagnais (Innu) (Aboriginal) 8,585
47 Hebrew 8,560
48 Telugu 8,280
49 Oji-Cree (Aboriginal) 7,900
50 Sinhala (Sinhalese) 7,790

Official languages:

English 22,162,870
French 6,943,800

Canada has the largest population of people who speak Punjabi (Panjabi) in all of the America's and one of the largest in the World (perhaps the largest) outside of Asia and the Middle East.

Top 50 permanent residents to Canada in 2017 by country of citizenship - Newly settled immigrants.

Canada 2017

1 India 51,655 18.03%
2 Philippines 40,850 14.26%
3 China, People's Republic of 30,280 10.57%
4 Syria 12,045 4.20%
5 United States of America 9,100 3.18%
6 Pakistan 7,655 2.67%
7 France 6,600 2.30%
8 Nigeria 5,460 1.91%
9 United Kingdom and Overseas Territories 5,295 1.85%
10 Iraq 4,740 1.65%

11 Iran 4,735 1.65%
12 Eritrea 4,680 1.63%
13 Korea, Republic of 3,975 1.39%
14 Jamaica 3,830 1.34%
15 Afghanistan 3,440 1.20%
16 Ukraine 3,305 1.15%
17 Bangladesh 3,185 1.11%
18 Mexico 3,135 1.09%
19 Egypt 2,865 1.00%
20 Brazil 2,760 0.96%

21 Algeria 2,635 0.92%
22 Vietnam 2,505 0.87%
23 Congo, Democratic Republic of the 2,400 0.84%
24 Haiti 2,330 0.81%
25 Russia 2,295 0.80%
26 Cameroon, Federal Republic of 2,285 0.80%
27 Morocco 2,270 0.79%
28 Colombia 2,230 0.78%
29 Sri Lanka 2,150 0.75%
30 Ireland, Republic of 1,965 0.69%

31 Ethiopia 1,915 0.67%
32 Australia 1,865 0.65%
33 Israel 1,865 0.65%
34 South Africa, Republic of 1,570 0.55%
35 Tunisia 1,435 0.50%
36 Ivory Coast, Republic of 1,400 0.49%
37 Somalia, Democratic Republic of 1,390 0.49%
38 Lebanon 1,365 0.48%
39 Hong Kong 1,270 0.44%
40 Germany 1,140 0.40%

41 Nepal 1,110 0.39%
42 Turkey 1,110 0.39%
43 Japan 1,080 0.38%
44 Italy 1,030 0.36%
45 Venezuela 1,020 0.36%
46 Poland 1,005 0.35%
47 Romania 975 0.34%
48 Cuba 875 0.31%
49 Burundi 805 0.28%
50 Taiwan 795 0.28%

Permanent Residents by Country of Citizenship: 286,475

Source: Immigration, Refugees and Citizenship Canada (IRCC)


Now it's time for Canada's largest city and metropolitan area -- Toronto!

Toronto is a global city and considered an Alpha City in the likes of Sydney (seen earlier) by the Globalization and World Cities Research Network (GaWC). It is also one of the fastest growing metropolitan areas in North America.


Image Source: rcmusic.com

Top 50 Non-Canadian countries or places of birth

Toronto CMA, Canada 2016

1 India (Bhārat) 307,275
2 China, People's Republic of 266,840
3 Philippines (Pilipinas), Republic of the 192,265
4 Pakistan 119,080
5 Italy (Italia) 103,620
6 Sri Lanka 101,545
7 China, Hong Kong (Special Administrative Region) 100,065
8 Jamaica 99,665
9 United Kingdom 99,165
10 Iran, Islamic Republic of 74,530

11 Portugal 71,045
12 Guyana 69,020
13 Vietnam (Việt Nam), Socialist Republic of 59,365
14 Poland (Polska) 57,450
15 United States 46,695
16 Korea, Republic of (South) 45,700
17 Trinidad and Tobago 43,130
18 Russian Federation (Russia) 34,380
19 Bangladesh 32,385
20 Ukraine 32,110

21 Iraq 29,230
22 Greece (Hellenic Republic) 27,890
23 Romania (România) 25,520
24 Afghanistan, Islamic Republic of 25,420
25 Egypt, Arab Republic of 24,815
26 Germany (Deutschland) 22,965
27 Colombia 17,150
28 Nigeria 16,395
29 Taiwan 14,975
30 Israel (Yisra'el) 13,670

31 Lebanese Republic (Lebanon) 13,610
32 Ghana 13,465
33 Serbia (Srbija) 13,085
34 South Africa, Republic of 13,040
35 Croatia (Hrvatska) 12,010
36 Hungary 11,925
37 United Arab Emirates 11,665
38 México (Estados Unidos Mexicanos) 11,390
39 Turkey (Türkiye) 11,355
40 Kenya 11,310

41 El Salvador 11,110
42 Ecuador 11,000
43 Ethiopia 10,865
44 Somalia 10,850
45 Syrian Arab Republic (Syria) 10,835
46 Brasil 10,620
47 Albania (Shqiperia) 10,135
48 Tanzania, United Republic of 9,720
49 Bosnia and Herzegovina 9,630
50 Saudi Arabia 9,435

Total Foreign-born: 2,705,550
Census Metropolitan Area (CMA) Population: 5,862,855

Toronto has the largest population born in Hong Kong and Sri Lanka of any metro area outside of Asia and the Middle East. One of the largest populations born in Italy in the Americas and the largest population born in Pakistan, currently (in the Americas). It also has the 2nd largest population born in India, Guyana, Trinidad and Tobago, Barbados and Saint Vincent and the Grenadines (of any metro area, save for NYC) in the Americas. Toronto also (currently) has the largest population of people that were born in Afghanistan in the Americas. However, this title is being challenged by D.C. and SF as immigration to the US from Afghanistan has increased significantly (over 19,000 in 2017) and those metros are the primary cities of settlement.

Top 50 languages spoken most often at home (non-official)

Toronto CMA, Canada 2016

1 Cantonese 182,750
2 Mandarin 179,670
3 Punjabi (Panjabi) 116,045
4 Urdu 78,110
5 Tamil 76,095
6 Spanish 70,370
7 Persian (Farsi) 67,320
8 Tagalog (Pilipino, Filipino) 63,985
9 Russian 53,675
10 Italian 51,820

11 Portuguese 50,210
12 Arabic 45,025
13 Korean 38,440
14 Gujarati 38,270
15 Polish 33,320
16 Vietnamese 31,760
17 Bengali 24,615
18 Hindi 23,995
19 Greek 16,945
20 Ukrainian 12,510

21 Serbian 12,200
22 Romanian 12,200
23 Turkish 8,155
24 Hungarian 7,880
25 Somali (Cushitic) 7,760
26 Armenian 7,470
27 Chinese, n.o.s. 6,890
28 Assyrian Neo-Aramaic 6,785
29 Malayalam 6,400
30 Albanian 6,385

31 Croatian 5,945
32 Min Nan (Chaochow, Teochow, Fukien, Taiwanese) 5,065
33 Macedonian 4,970
34 Telugu 4,875
35 Pashto 4,850
36 Japanese 4,550
37 Hebrew 4,390
38 Akan (Twi) 4,045
39 Bulgarian 3,855
40 Amharic 3,820

41 Tibetan 3,705
42 German 3,590
43 Sinhala (Sinhalese) 3,575
44 Ilocano 3,455
45 Wu (Shanghainese) 3,130
46 Nepali 3,085
47 Hakka 2,725
48 Sindhi 2,485
49 Tigrigna 2,480
50 Slovak 2,290

Official languages:

English 3,836,765
French 29,800

Toronto has the largest population in the Americas that speak Punjabi (Panjabi) and Tamil.

Now it's off to the 2nd largest metropolitan area in Canada -- Montréal!


Image Source: Simon Velazquez@pinterest.com

Top 50 Non-Canadian countries or places of birth

Montréal CMA, Canada 2016

1 Haïti 75,740
2 France 56,805
3 Morocco (Al Maghrib) 54,495
4 Algeria (Al Jaza'ir) 54,275
5 Italy (Italia) 48,935
6 China, People's Republic of 43,350
7 Lebanese Republic (Lebanon) 35,770
8 Romania (România) 26,145
9 Vietnam (Việt Nam), Socialist Republic of 23,465
10 Philippines (Pilipinas), Republic of the 23,235

11 Egypt, Arab Republic of 18,500
12 United States 17,935
13 Greece (Hellenic Republic) 17,890
14 India (Bhārat) 17,460
15 Colombia 16,670
16 Iran, Islamic Republic of 16,545
17 Portugal 16,460
18 Syrian Arab Republic (Syria) 16,310
19 México (Estados Unidos Mexicanos) 13,080
20 Tunisian Republic (Tunisia) 12,075

21 Perú 11,905
22 Sri Lanka 10,620
23 United Kingdom 10,385
24 Russian Federation (Russia) 10,290
25 El Salvador 9,955
26 Cameroon 9,950
27 Pakistan 9,515
28 Poland (Polska) 9,380
29 Congo (Zaire), Democratic Republic of the 8,595
30 Moldova, Republic of 8,385

31 Cambodia (Kampuchea) 8,240
32 Ukraine 7,755
33 Bangladesh 7,745
34 Chile 7,385
35 Germany (Deutschland) 6,590
36 Côte d'Ivoire 6,510
37 Afghanistan, Islamic Republic of 6,155
38 Turkey (Türkiye) 6,070
39 Belgium, Kingdom of 5,745
40 Mauritius (Maurice) 5,740

41 Brasil 5,725
42 Bulgaria (Balgariya) 5,525
43 Venezuela, Bolivarian Republic of 5,310
44 Guatemala 4,905
45 Cuba 4,855
46 Dominican Republic (República Dominicana) 4,700
47 Israel (Yisra'el) 4,670
48 Senegal 4,670
49 China, Hong Kong (Special Administrative Region) 4,530
50 Jamaica 4,420

Total Foreign-born: 936,305
Census Metropolitan Area (CMA) Population: 4,009,790

Montréal has the largest population that was born in France, Morocco, Lebanon, Algeria and Tunisia of any metro in all of the Americas.

Top 50 languages spoken most often at home (non-official)

Montréal CMA, Canada 2016

1 Spanish 76,675
2 Arabic 72,980
3 Mandarin 34,295
4 Italian 32,365
5 Romanian 22,945
6 Russian 19,390
7 Creole, n.o.s. 18,775
8 Vietnamese 18,700
9 Persian (Farsi) 18,305
10 Greek 18,250

11 Cantonese 17,325
12 Portuguese 14,570
13 Armenian 11,840
14 Tamil 10,670
15 Punjabi (Panjabi) 8,775
16 Bengali 8,080
17 Tagalog (Pilipino, Filipino) 7,750
18 Urdu 7,070
19 Yiddish 6,665
20 Polish 5,395

21 Bulgarian 4,750
22 Khmer (Cambodian) 4,720
23 Kabyle (Berber) 4,605
24 Turkish 4,420
25 Gujarati 3,805
26 Korean 3,400
27 Berber languages, n.i.e. (Berber) 2,220
28 Chinese, n.o.s. 2,160
29 Ukrainian 2,155
30 Lao 1,875

31 Hungarian 1,815
32 Min Nan (Chaochow, Teochow, Fukien, Taiwanese) 1,780
33 Hebrew 1,680
34 German 1,585
35 Hindi 1,480
36 Albanian 1,445
37 Serbian 1,065
38 Pashto 875
39 Japanese 875
40 Niger-Congo languages, n.i.e. 835

41 Haitian Creole 780
42 Croatian 775
43 Wolof 770
44 Wu (Shanghainese) 760
45 Ilocano 740
46 Lingala 480
47 Rundi (Kirundi) 465
48 Akan (Twi) 440
49 Fulah (Pular, Pulaar, Fulfulde) 440
50 Creole languages, n.i.e. 420

Official languages:

English 620,510
French 2,669,195

Off to the 3rd largest on the beautiful west coast of British Columbia -- Vancouver!


Image Source: helivideopros.com

Top 50 Non-Canadian countries or places of birth

Vancouver CMA, Canada 2016

1 China, People's Republic of 188,970
2 India (Bhārat) 125,640
3 Philippines (Pilipinas), Republic of the 96,685
4 China, Hong Kong (Special Administrative Region) 71,720
5 United Kingdom 56,525
6 Taiwan 37,425
7 Korea, Republic of (South) 36,865
8 Iran, Islamic Republic of 35,250
9 United States 26,450
10 Vietnam (Việt Nam), Socialist Republic of 24,030

11 Fiji Islands 16,665
12 Germany (Deutschland) 13,520
13 Japan 10,675
14 Poland (Polska) 10,475
15 Italy (Italia) 10,395
16 Pakistan 9,220
17 Russian Federation (Russia) 8,460
18 South Africa, Republic of 8,205
19 México (Estados Unidos Mexicanos) 7,850
20 Malaysia 7,515

21 Romania (România) 7,110
22 Netherlands (Nederland) 6,300
23 Ukraine 5,480
24 Iraq 5,215
25 Singapore 4,955
26 Afghanistan, Islamic Republic of 4,865
27 Portugal 4,660
28 Australia 4,520
29 El Salvador 4,400
30 Sri Lanka 4,155

31 Indonesia 4,120
32 Croatia (Hrvatska) 4,115
33 Kenya 4,065
34 Bosnia and Herzegovina 3,930
35 Ireland, Republic of (Éire) 3,830
36 Serbia (Srbija) 3,775
37 Hungary 3,700
38 France 3,440
39 Czech Republic (Česká Republika) 3,230
40 Colombia 3,075

41 Greece (Hellenic Republic) 2,890
42 Brasil 2,855
43 Tanzania, United Republic of 2,705
44 Perú 2,700
45 Thailand 2,645
46 Uganda 2,490
47 New Zealand (Aotearoa) 2,410
48 Chile 2,315
49 Syrian Arab Republic (Syria) 2,310
50 Jamaica 2,230

Total Foreign-born: 989,545
Census Metropolitan Area (CMA) Population: 2,426,235

At least up until 2016 Vancouver had the largest population of people that were born in Fiji of any metro in all of the Americas. It just may have been surprised by SF in 2017 as it was estimated to be over 19,000. Vancouver's metro also has the 2nd largest population of people that were born in Hong Kong outside of Asia.

Top 50 languages spoken most often at home (non-official)

Vancouver 2016

1 Mandarin 138,680
2 Cantonese 132,185
3 Punjabi (Panjabi) 104,855
4 Korean 34,225
5 Tagalog (Pilipino, Filipino) 30,700
6 Persian (Farsi) 27,355
7 Spanish 18,310
8 Vietnamese 14,365
9 Hindi 11,235
10 Russian 10,790

11 Arabic 8,680
12 Japanese 8,235
13 Urdu 5,170
14 Portuguese 5,115
15 Chinese, n.o.s. 5,045
16 Min Nan (Chaochow, Teochow, Fukien, Taiwanese) 4,645
17 Polish 4,485
18 Italian 3,950
19 Serbian 3,470
20 Romanian 3,215

21 German 2,895
22 Gujarati 2,740
23 Wu (Shanghainese) 2,495
24 Tamil 1,935
25 Croatian 1,795
26 Greek 1,730
27 Bengali 1,575
28 Hungarian 1,470
29 Ilocano 1,465
30 Turkish 1,190

31 Cebuano 1,085
32 Malay 1,055
33 Czech 1,025
34 Kurdish 1,020
35 Ukrainian 1,010
36 Bulgarian 925
37 Malayalam 890
38 Hebrew 785
39 Slovak 780
40 Dutch 685

41 Burmese 685
42 Karenic languages 685
43 Hakka 670
44 Thai 670
45 Pashto 660
46 Khmer (Cambodian) 620
47 Somali ( Cushitic) 615
48 Sinhala (Sinhalese) 595
49 Sindhi 590
50 Nepali 550

Official languages:

English 1,622,740
French 8,625

Vancouver has the 2nd largest population of speakers of Punjabi (Panjabi) in Canada and all of the Americas.

...Hope you enjoyed as that is all for tonight! Stay tuned for more as we are not done exploring Canada (of which it will be followed by the UK)!

Last edited by Urbanguy; Sep 25, 2018 at 2:23 PM.
Reply With Quote
     
     
  #12  
Old Posted Sep 25, 2018, 4:50 AM
tayser's Avatar
tayser tayser is offline
Vires acquirit eundo
 
Join Date: Mar 2002
Location: Melbourne
Posts: 3,231
Quote:
Originally Posted by Urbanguy View Post
Sure, I'll give you a couple of examples as the numbers seem to indicate this quite well and this off of a couple of the earliest set of immigrants....

Australia

1. population born in Italy in 2016: 174,042
2. population that speaks Italian at home in 2016: 271,602

The population speaking Italian at home is nearly a 100,000 more than the population of those that were born in Italy -- which clearly indicates that it is being passed on.

For the sake of comparison by 1881 both Canada & Australia had similar amounts of Italians -- Canada nearly 2,000 (source: Italian Canadians & Australia roughly 1,700 to 2,100 (source: Italian Migration to Australia). Both countries experienced large scale migration from Italy following WWII until at least the 1970s.

Using similar metrics for...

Canada

1. population born in Italy in 2016: 242,255
2. population that speaks Italian at home in 2016: 115,415 (spoken most often at home) or another figure of language spoken at home: 318,245 (single & multiple responses).

Source: Statscan, Census 2016

Notice that the rate is much higher in Australia even if you include the largest figure in Canada using single & multiple responses?

Let's take a look at the Greek's...

Australia

1. population born in Greece in 2016: 93,743 + Cyprus 16,929 = 110,672
2. population that speaks Greek at home in 2016: 237,583

Canada

1. population born in Greece in 2016: 65,225 + Cyprus 4,200 = 69,425
2. population that speaks Greek at home in 2016: 44,545 (spoken most often at home) or another figure of language spoken at home: 114,915 (single & multiple responses).

The native language retention is still at a higher rate in Australia even when you throw in Cyprus (which has both Greeks and Turks) or not.

Hope this helps.
I wonder if SBS has anything to do with? It's the second, smaller, public broadcaster in Australia (ABC the larger and older one) - set up specifically for the multicultural community in the 70s.

Every day the morning TV broadcasts are all 30 minute bulletins from offshore broadcasters (i.e RAI for Italian, TF1 for French, CCTV for Chinese, HRT for Croatian etc)... in short, there's many different languages on bog-standard free-to-air broadcast TV (and has been since the 70s) which would help in retention of LOTE in everyone's homes.

edit: LOTE = Languages Other Than English (term is used group foreign languages taught in schools).

edit 2: SBS also broadcasts PBS Newshour for the American part of our multi-cultural community (No CBC/Radio-Canada however).
Reply With Quote
     
     
  #13  
Old Posted Sep 25, 2018, 7:11 PM
Capsicum's Avatar
Capsicum Capsicum is offline
Registered User
 
Join Date: Sep 2017
Location: Western Hemisphere
Posts: 2,489
Quote:
Originally Posted by Urbanguy View Post
^Even though Australia has its fair share of racism especially towards Aborigines, certain immigrant groups and controversial policies towards Asylum seekers that travel by boat it has really become a popular destination.

I also wonder if the immigrants there and their descendants are slow to assimilate being that many retain their native languages in a predominately English-speaking country.
Quote:
Originally Posted by Acajack View Post
I'd like to hear more about this. I am not really challenging you - on the one hand I've heard this before about Australia, but on the other I've been there and am quite familiar with Australian society, and didn't find it was significantly different from most of Anglo North America in terms of the overall immigrant experience.

So... I'm curious.
Quote:
Originally Posted by tayser View Post
I wonder if SBS has anything to do with? It's the second, smaller, public broadcaster in Australia (ABC the larger and older one) - set up specifically for the multicultural community in the 70s.

Every day the morning TV broadcasts are all 30 minute bulletins from offshore broadcasters (i.e RAI for Italian, TF1 for French, CCTV for Chinese, HRT for Croatian etc)... in short, there's many different languages on bog-standard free-to-air broadcast TV (and has been since the 70s) which would help in retention of LOTE in everyone's homes.

edit: LOTE = Languages Other Than English (term is used group foreign languages taught in schools).

edit 2: SBS also broadcasts PBS Newshour for the American part of our multi-cultural community (No CBC/Radio-Canada however).
Cool thread! I had asked the question about assimilation in a past thread earlier in the year.

Cities with least assimilation/most cultural retention among immigrant generations?

The Aussie stats are interesting. The perception seems to be that Australia is a bit more "assimilationist" and "nativist" than Canada, but I guess the actually numbers show multiculturalism is lived up to more there, at least language-wise!
Reply With Quote
     
     
  #14  
Old Posted Sep 25, 2018, 8:33 PM
Urbanguy's Avatar
Urbanguy Urbanguy is offline
Go Beavs! Go Niners!
 
Join Date: Dec 2001
Location: Portland | Honolulu
Posts: 6,209
There's also this other point of which I posted from the Australian Census earlier in this thread.

"According to the Australian Census -- there were more than 150 Australian Indigenous languages spoken at home. Between 1991 and 2016, the proportion of Aboriginal and Torres Strait Islander peoples reporting English as their main language spoken at home increased from 79 per cent to 84 per cent. In contrast, the proportion of non-Indigenous people who spoke English at home decreased over the same period, from 84 per cent to 77 per cent."
Reply With Quote
     
     
  #15  
Old Posted Sep 25, 2018, 8:58 PM
Acajack's Avatar
Acajack Acajack is offline
Unapologetic Occidental
 
Join Date: Aug 2006
Location: Province 2, Canadian Empire
Posts: 68,143
Quote:
Originally Posted by tayser View Post
I wonder if SBS has anything to do with? It's the second, smaller, public broadcaster in Australia (ABC the larger and older one) - set up specifically for the multicultural community in the 70s.

Every day the morning TV broadcasts are all 30 minute bulletins from offshore broadcasters (i.e RAI for Italian, TF1 for French, CCTV for Chinese, HRT for Croatian etc)... in short, there's many different languages on bog-standard free-to-air broadcast TV (and has been since the 70s) which would help in retention of LOTE in everyone's homes.

edit: LOTE = Languages Other Than English (term is used group foreign languages taught in schools).

edit 2: SBS also broadcasts PBS Newshour for the American part of our multi-cultural community (No CBC/Radio-Canada however).
Canada does not have a public "ethnic" broadcaster like SBS, but has had quite a bit of private media (radio and TV) in non-official languages for many decades, based both in Toronto and Montreal, and accessible by communities in other cities like Ottawa, Hamilton, etc. These media offer stuff from the old country as well content produced in Canada in immigrant languages.

I am not sure if this has anything significant to do with language retention, though.
__________________
The Last Word.

Last edited by Acajack; Sep 25, 2018 at 9:27 PM.
Reply With Quote
     
     
  #16  
Old Posted Sep 25, 2018, 9:07 PM
Acajack's Avatar
Acajack Acajack is offline
Unapologetic Occidental
 
Join Date: Aug 2006
Location: Province 2, Canadian Empire
Posts: 68,143
Quote:
Originally Posted by Capsicum View Post
Cool thread! I had asked the question about assimilation in a past thread earlier in the year.

Cities with least assimilation/most cultural retention among immigrant generations?

The Aussie stats are interesting. The perception seems to be that Australia is a bit more "assimilationist" and "nativist" than Canada, but I guess the actually numbers show multiculturalism is lived up to more there, at least language-wise!
My first instinct was that the questions were asked differently or that the criteria were not quite the same.

As I've mentioned before, I am Canadian and know Australia quite well, and Down Under does not seem outwardly any more or less assimilationist than the Great White North does.

I know that there is a kind of "meme" about Montreal that speakers of non-official languages there retain them longer due to the push and pull between French and English, so continuing to use Italian, Spanish, Greek or whatever, avoid the issue of having to choose between the two official languages jostling for position. You don't have this at play in Toronto, which would explain why there is more rapid intergenerational language loss there than in Montreal.

But based on the numbers posted here, places like Sydney and Melbourne which are totally English-dominant in officialdom and even officiousdom, have even greater immigrant language retention than Montreal, which is often said to be one of the *better* (assuming this is seen as good) performers on this front.

So I wanna know - what's going on in Australia? (It's not related to not having a legally designated official language - I don't buy that either.)

Residential segregation?

Low(er) levels of exogamy/inter-marriage?
__________________
The Last Word.
Reply With Quote
     
     
  #17  
Old Posted Sep 25, 2018, 10:11 PM
softee's Avatar
softee softee is offline
Aimless Wanderer
 
Join Date: Jan 2003
Location: Downtown Toronto
Posts: 3,392
Awesome breakdown, I love reading stuff like this.

I'm not sure where that figure for the Toronto CMA population came from, the 2016 census has the Toronto CMA at 5,928,040. The numbers for the Greater Toronto Area (which also includes the adjacent Oshawa CMA and the city of Burlington and the remainder of Halton Region) would bump some of those foreign born and language groups up a bit, but not by much -- but including Hamilton (The Greater Toronto-Hamilton Area is a continuous urban area) would have a bit more impact on the figures.
__________________
Public transit is the lifeblood of every healthy city.
Reply With Quote
     
     
  #18  
Old Posted Sep 25, 2018, 10:59 PM
bnk bnk is offline
BANNED
 
Join Date: Mar 2006
Location: chicagoland
Posts: 12,741
There is not enough data and pictures in this thread.

Its missing 193 countries.
Reply With Quote
     
     
  #19  
Old Posted Sep 26, 2018, 12:03 AM
Urbanguy's Avatar
Urbanguy Urbanguy is offline
Go Beavs! Go Niners!
 
Join Date: Dec 2001
Location: Portland | Honolulu
Posts: 6,209
Quote:
Originally Posted by softee View Post
Awesome breakdown, I love reading stuff like this.

I'm not sure where that figure for the Toronto CMA population came from, the 2016 census has the Toronto CMA at 5,928,040. The numbers for the Greater Toronto Area (which also includes the adjacent Oshawa CMA and the city of Burlington and the remainder of Halton Region) would bump some of those foreign born and language groups up a bit, but not by much -- but including Hamilton (The Greater Toronto-Hamilton Area is a continuous urban area) would have a bit more impact on the figures.
Hi Softee, both figures I used were taken from the 25% Census sample of the "Immigration and Ethnocultural Diversity Highlight Tables" which did both country of birth (in great detail) and total population (found here >> Click Me). That particular section has Oshawa as a separate entity.

...and now the journey continues to one of the fastest growing regions in the country.

Here is Calgary!


Image Source: artcountrycanada.com

Top 50 Non-Canadian countries or places of birth

Calgary CMA, Canada 2016

1 Philippines (Pilipinas), Republic of the 53,450
2 India (Bhārat) 46,945
3 China, People's Republic of 34,940
4 United Kingdom 26,180
5 Pakistan 17,740
6 Vietnam (Việt Nam), Socialist Republic of 15,700
7 United States 12,110
8 China, Hong Kong (Special Administrative Region) 11,115
9 Nigeria 7,690
10 Korea, Republic of (South) 7,285

11 Poland (Polska) 6,840
12 Germany (Deutschland) 6,485
13 Colombia 5,805
14 Iran, Islamic Republic of 5,800
15 Ethiopia 5,230
16 Romania (România) 4,515
17 México (Estados Unidos Mexicanos) 4,485
18 Lebanese Republic (Lebanon) 4,335
19 Russian Federation (Russia) 4,000
20 Italy (Italia) 3,855

21 Iraq 3,655
22 Netherlands (Nederland) 3,385
23 Afghanistan, Islamic Republic of 3,285
24 Bangladesh 3,150
25 Jamaica 3,085
26 Venezuela, Bolivarian Republic of 3,080
27 South Africa, Republic of 3,015
28 Ukraine 2,965
29 Egypt, Arab Republic of 2,930
30 Tanzania, United Republic of 2,855

31 Kenya 2,740
32 El Salvador 2,450
33 Eritrea (Ertra) 2,270
34 Taiwan 2,240
35 Syrian Arab Republic (Syria) 2,190
36 Malaysia 2,095
37 Bosnia and Herzegovina 2,070
38 Sri Lanka 2,010
39 Hungary 1,960
40 Nepal 1,855

41 Chile 1,820
42 Ireland, Republic of (Éire) 1,685
43 Australia 1,630
44 Japan 1,550
45 Fiji Islands 1,500
46 Brasil 1,475
47 Trinidad and Tobago 1,470
48 Cambodia (Kampuchea) 1,465
49 South Sudan 1,465
50 Ghana 1,370

Total Foreign-born: 404,700
Census Metropolitan Area (CMA) Population: 1,374,655

Top 50 languages spoken most often at home (non-official)

Calgary CMA, Canada 2016

1 Punjabi (Panjabi) 29,100
2 Tagalog (Pilipino, Filipino) 23,010
3 Cantonese 22,245
4 Mandarin 21,140
5 Spanish 17,535
6 Urdu 11,060
7 Arabic 11,010
8 Vietnamese 8,925
9 Korean 6,565
10 Persian (Farsi) 6,475

11 Russian 5,785
12 Hindi 4,125
13 Polish 3,275
14 Gujarati 3,130
15 Bengali 2,745
16 Amharic 2,730
17 Romanian 2,475
18 Tigrigna 2,045
19 Portuguese 1,770
20 Chinese, n.o.s. 1,605

21 German 1,540
22 Nepali 1,335
23 Hungarian 1,310
24 Malayalam 1,295
25 Italian 1,270
26 Tamil 1,190
27 Japanese 1,110
28 Pashto 1,050
29 Ilocano 1,025
30 Serbian 945

31 Somali (Cushitic) 885
32 Cebuano 865
33 Ukrainian 790
34 Turkish 755
35 Croatian 745
36 Sindhi 745
37 Oromo (Cushitic) 710
38 Min Nan (Chaochow, Teochow, Fukien, Taiwanese) 675
39 Albanian 620
40 Telugu 560

41 Afrikaans 505
42 Greek 500
43 Indo-Iranian languages, n.i.e. 500
44 Dutch 490
45 Sinhala (Sinhalese) 485
46 Bulgarian 480
47 Slovak 465
48 Nilo-Saharan languages, n.i.e. 465
49 Kurdish 460
50 Marathi 445

Official languages:

English 1,065,075
French 8,625

and now for the 2nd largest metro area in Alberta and 6th largest (maybe 5th now?) in all of Canada -- Edmonton!


Image Source: Tandareanu@flickr.com

Top 50 Non-Canadian countries or places of birth

Edmonton CMA, Canada 2016

1 Philippines (Pilipinas), Republic of the 45,400
2 India (Bhārat) 38,825
3 China, People's Republic of 19,705
4 United Kingdom 16,875
5 Vietnam (Việt Nam), Socialist Republic of 10,420
6 United States 8,605
7 Pakistan 8,250
8 Poland (Polska) 8,005
9 China, Hong Kong (Special Administrative Region) 7,355
10 Germany (Deutschland) 7,135

11 Lebanese Republic (Lebanon) 5,055
12 Korea, Republic of (South) 4,980
13 Somalia 4,590
14 Ethiopia 4,015
15 Netherlands (Nederland) 3,830
16 Ukraine 3,770
17 Italy (Italia) 3,520
18 Nigeria 3,255
19 El Salvador 3,055
20 Fiji Islands 2,820

21 Jamaica 2,800
22 Iran, Islamic Republic of 2,720
23 Colombia 2,605
24 Portugal 2,575
25 México (Estados Unidos Mexicanos) 2,440
26 Romania (România) 2,335
27 Russian Federation (Russia) 2,330
28 South Africa, Republic of 2,250
29 Sri Lanka 2,120
30 Iraq 2,100

31 Chile 2,090
32 Egypt, Arab Republic of 2,055
33 Eritrea (Ertra) 2,025
34 Syrian Arab Republic (Syria) 2,015
35 Kenya 1,995
36 Malaysia 1,985
37 Bosnia and Herzegovina 1,940
38 Congo (Zaire), Democratic Republic of the 1,765
39 Trinidad and Tobago 1,630
40 Bangladesh 1,610

41 Brunei Darussalam 1,560
42 Ireland, Republic of (Éire) 1,520
43 Nepal 1,520
44 Afghanistan, Islamic Republic of 1,490
45 Tanzania, United Republic of 1,465
46 Croatia (Hrvatska) 1,435
47 Ghana 1,415
48 Guyana 1,405
49 Zimbabwe 1,395
50 Turkey (Türkiye) 1,350

Total Foreign-born: 308,605
Census Metropolitan Area (CMA) Population: 1,297,280

Top 50 languages spoken most often at home (non-official)

Edmonton CMA, Canada 2016

1 Tagalog (Pilipino, Filipino) 20,765
2 Punjabi (Panjabi) 20,650
3 Mandarin 14,725
4 Cantonese 14,700
5 Spanish 10,880
6 Arabic 10,590
7 Vietnamese 5,860
8 Urdu 5,100
9 Hindi 5,095
10 Somali (Cushitic) 4,740

11 Korean 4,565
12 Polish 3,810
13 Gujarati 3,650
14 Russian 3,260
15 Persian (Farsi) 3,215
16 Ukrainian 2,395
17 Malayalam 2,330
18 German 2,320
19 Portuguese 1,915
20 Amharic 1,695

21 Tigrigna 1,655
22 Bengali 1,455
23 Tamil 1,440
24 Chinese, n.o.s. 1,440
25 Italian 1,410
26 Nepali 1,395
27 Romanian 1,355
28 Turkish 1,135
29 Serbian 1,005
30 Croatian 895

31 Oromo (Cushitic) 885
32 Cebuano 810
33 Sinhala (Sinhalese) 780
34 Ilocano 605
35 Swahili 585
36 Telugu 555
37 Min Nan (Chaochow, Teochow, Fukien, Taiwanese) 550
38 Niger-Congo languages, n.i.e. 495
39 Japanese 475
40 Hungarian 475

41 Sindhi 465
42 Akan (Twi) 445
43 Pashto 430
44 Khmer (Cambodian) 385
45 Creole, n.o.s. 380
46 Greek 375
47 Kurdish 375
48 Albanian 370
49 Karenic languages 360
50 Marathi 335

Official languages:

English 1,050,410
French 10,945

Eastward we go to the Capital of Canada -- Ottawa!


Image Source: vogue.com

Top 50 Non-Canadian countries or places of birth

Ottawa - Gatineau CMA, Canada 2016

1 China, People's Republic of 18,900
2 United Kingdom 17,230
3 Lebanese Republic (Lebanon) 13,560
4 India (Bhārat) 10,685
5 United States 9,530
6 Philippines (Pilipinas), Republic of the 9,305
7 Haïti 8,515
8 Vietnam (Việt Nam), Socialist Republic of 5,980
9 Italy (Italia) 5,675
10 Iran, Islamic Republic of 4,900

11 Germany (Deutschland) 4,560
12 Poland (Polska) 4,530
13 France 4,470
14 Congo (Zaire), Democratic Republic of the 4,245
15 Somalia 3,990
16 Pakistan 3,980
17 Iraq 3,870
18 Egypt, Arab Republic of 3,745
19 Syrian Arab Republic (Syria) 3,615
20 Portugal 3,435

21 Romania (România) 3,370
22 Russian Federation (Russia) 3,190
23 Jamaica 3,175
24 China, Hong Kong (Special Administrative Region) 3,095
25 Morocco (Al Maghrib) 2,775
26 Colombia 2,740
27 Bangladesh 2,695
28 Burundi 2,510
29 Afghanistan, Islamic Republic of 2,505
30 Sri Lanka 2,400

31 Kuwait (Al Kuwayt) 2,380
32 Bosnia and Herzegovina 2,340
33 Ethiopia 2,320
34 Netherlands (Nederland) 2,280
35 Algeria (Al Jaza'ir) 2,245
36 El Salvador 2,165
37 Ukraine 2,010
38 Korea, Republic of (South) 1,855
39 México (Estados Unidos Mexicanos) 1,825
40 Cameroon 1,610

41 Cambodia (Kampuchea) 1,535
42 Guyana 1,420
43 Nigeria 1,390
44 Trinidad and Tobago 1,360
45 Saudi Arabia 1,315
46 Brasil 1,295
47 Rwanda 1,280
48 Jordan (Al Urdun) 1,250
49 United Arab Emirates 1,210
50 Kenya 1,165

Total Foreign-born: 255,800
Census Metropolitan Area (CMA) Population: 1,300,730

Top 50 languages spoken most often at home (non-official)

Ottawa - Gatineau CMA, Canada 2016

1 Arabic 22,945
2 Mandarin 14,600
3 Spanish 9,360
4 Cantonese 5,990
5 Persian (Farsi) 4,385
6 Russian 4,125
7 Vietnamese 3,935
8 Somali (Cushitic) 3,785
9 Portuguese 3,020
10 Tagalog (Pilipino, Filipino) 2,785

11 Italian 2,580
12 Urdu 2,285
13 Punjabi (Panjabi) 2,225
14 Polish 2,170
15 Bengali 1,990
16 Creole, n.o.s. 1,960
17 Romanian 1,865
18 Serbian 1,490
19 Tamil 1,310
20 Hindi 1,310

21 Korean 1,220
22 Amharic 865
23 Turkish 800
24 German 780
25 Nepali 735
26 Greek 670
27 Pashto 655
28 Chinese, n.o.s. 635
29 Gujarati 620
30 Khmer (Cambodian) 590

31 Ukrainian 575
32 Bulgarian 565
33 Swahili 560
34 Hungarian 495
35 Rundi (Kirundi) 480
36 Serbo-Croatian 465
37 Japanese 440
38 Kurdish 435
39 Tigrigna 430
40 Croatian 430

41 Bosnian 425
42 Sinhala (Sinhalese) 400
43 Kabyle (Berber) 380
44 Kinyarwanda (Rwanda) 335
45 Albanian 320
46 Min Nan (Chaochow, Teochow, Fukien, Taiwanese) 300
47 Malayalam 285
48 Armenian 250
49 Niger-Congo languages, n.i.e. 250
50 Wu (Shanghainese) 250

Official languages:

English 768,215
French 353,425

Now we travel on to Ville de Québec!


Image Source: ville.quebec.qc.ca

Top 50 Non-Canadian countries or places of birth

Québec City (Ville de Québec), Canada 2016

1 France 8,165
2 Colombia 2,790
3 Morocco (Al Maghrib) 2,190
4 Algeria (Al Jaza'ir) 1,940
5 China, People's Republic of 1,775
6 Tunisian Republic (Tunisia) 1,450
7 United States of America 1,175
8 Cameroon 1,140
9 Haïti 1,140
10 Côte d'Ivoire 1,065

11 Brasil 925
12 México (Estados Unidos Mexicanos) 920
13 Bosnia and Herzegovina 900
14 Belgium, Kingdom of 870
15 Congo (Zaire), Democratic Republic of the 870
16 Germany (Deutschland) 790
17 Vietnam (Việt Nam), Socialist Republic of 790
18 Romania (România) 705
19 Sénégal 550
20 Portugal 515

21 Burundi 485
22 Perú 460
23 Cambodia (Kampuchea) 440
24 Bhutan (Druk-yul) 435
25 Italy (Italia) 435
26 Chile 410
27 El Salvador 400
28 Cuba 395
29 Rwanda 370
30 Iran, Islamic Republic of 340

31 Syrian Arab Republic (Syria) 340
32 Switzerland (Swiss Confederation) 330
33 Lebanese Republic (Lebanon) 290
34 Poland (Polska) 285
35 Nepal 280
36 United Kingdom 270
37 Bénin 265
38 Egypt, Arab Republic of 265
39 Ukraine 265
40 Moldova, Republic of 260

41 Russian Federation (Russia) 260
42 Tanzania, United Republic of 255
43 Madagascar (Madagasikara) 230
44 Guinea (Guinée) 215
45 Spain (España) 210
46 Argentine Republic (Argentina) 200
47 Central African Republic (Republique Centrafricaine) 200
48 Dominican Republic (República Dominicana) 200
49 Myanmar (Burma) 185
50 Venezuela, Bolivarian Republic of 185

Total Foreign-born: 44,550
Census Metropolitan Area (CMA) Population: 779,085

Top 50 languages spoken most often at home (non-official)

Québec CMA, Canada 2016

1 Spanish 4,505
2 Arabic 1,975
3 Portuguese 1,085
4 Nepali 820
5 Mandarin 670
6 Vietnamese 490
7 Romanian 460
8 Russian 410
9 Bosnian 375
10 Persian (Farsi) 360

11 Montagnais (Innu) (Aboriginal) 255
12 Khmer (Cambodian) 185
13 Niger-Congo languages, n.i.e. 185
14 Rundi (Kirundi) 175
15 Swahili 170
16 Cantonese 165
17 Kabyle (Berber) 160
18 Bulgarian 140
19 Serbo-Croatian 140
20 Creole, n.o.s. 135

21 Italian 120
22 Albanian 105
23 Serbian 105
24 Wolof 105
25 Polish 100
26 German 90
27 Indo-Iranian languages, n.i.e. 90
28 Berber languages, n.i.e. (Berber) 70
29 Malagasy 70
30 Ukrainian 70

31 Karenic languages 70
32 Japanese 60
33 Chinese, n.o.s. 60
34 Croatian 55
35 Kinyarwanda (Rwanda) 50
36 Bengali 45
37 Lao 40
38 Armenian 35
39 Lingala 30
40 Thai 30

41 Dutch 25
42 Kurdish 25
43 Hungarian 25
44 Tagalog (Pilipino, Filipino) 20
45 Fulah (Pular, Pulaar, Fulfulde) 20
46 Min Nan (Chaochow, Teochow, Fukien, Taiwanese) 20
47 Turkish 20
48 Greek 15
49 Gujarati 15
50 Hindi 15

Official languages:

English 8,360
French 754,825

...and now we go back out west to Winnipeg!


Image Source: wbdmb.ca

Top 50 Non-Canadian countries or places of birth

Winnipeg, Canada 2016

1 Philippines (Pilipinas), Republic of the 57,160
2 India (Bhārat) 19,630
3 China, People's Republic of 7,605
4 United Kingdom 7,550
5 Germany (Deutschland) 4,795
6 Poland (Polska) 4,680
7 United States of America 4,470
8 Vietnam (Việt Nam), Socialist Republic of 4,100
9 Portugal 4,060
10 Ukraine 3,820

11 Nigeria 3,525
12 Pakistan 2,845
13 Italy (Italia) 2,600
14 Korea, Republic of (South) 2,585
15 Ethiopia 2,230
16 Russian Federation (Russia) 2,165
17 Jamaica 1,605
18 Paraguay (Paraguáype) 1,580
19 El Salvador 1,510
20 Trinidad and Tobago 1,420

21 China, Hong Kong (Special Administrative Region) 1,395
22 Israel (Yisra'el) 1,345
23 Eritrea (Ertra) 1,325
24 Congo (Zaire), Democratic Republic of the 1,270
25 Netherlands (Nederland) 1,235
26 Iran, Islamic Republic of 1,105
27 Guyana 1,080
28 Bosnia and Herzegovina 1,015
29 Sri Lanka 970
30 Croatia (Hrvatska) 920

31 Kenya 900
32 Egypt, Arab Republic of 895
33 Lao People's Democratic Republic (Laos) 885
34 Bangladesh 850
35 Iraq 850
36 México (Estados Unidos Mexicanos) 805
37 Greece (Hellenic Republic) 780
38 Chile 775
39 Somalia 750
40 Hungary (Magyarország) 700

41 Argentine Republic (Argentina) 690
42 Syrian Arab Republic (Syria) 690
43 Romania (România) 645
44 Thailand 615
45 Afghanistan, Islamic Republic of 610
46 Sudan 595
47 France 570
48 Kazakhstan (Qazaqstan) 570
49 Colombia 545
50 South Africa, Republic of 545

Total Foreign-born: 181,965
Census Metropolitan Area (CMA) Population: 761,540

Top 50 languages spoken most often at home (non-official)

Winnipeg CMA, Canada 2016

1 Tagalog (Pilipino, Filipino) 23,565
2 Punjabi (Panjabi) 13,375
3 Mandarin 6,910
4 Cantonese 4,065
5 Russian 3,805
6 Spanish 3,415
7 German 3,000
8 Arabic 2,855
9 Vietnamese 2,680
10 Portuguese 2,680

11 Korean 2,550
12 Polish 1,855
13 Ukrainian 1,815
14 Urdu 1,695
15 Gujarati 1,330
16 Persian (Farsi) 1,270
17 Hindi 1,200
18 Tigrigna 1,080
19 Italian 1,005
20 Amharic 875

21 Somali (Cushitic) 830
22 Bengali 660
23 Nepali 535
24 Chinese, n.o.s. 515
25 Greek 490
26 Swahili 465
27 Lao 400
28 Ilocano 375
29 Ojibway (Aboriginal) 370
30 Karenic languages 355

31 Cebuano 345
32 Hebrew 340
33 Sinhala (Sinhalese) 340
34 Serbian 330
35 Croatian 290
36 Yoruba 290
37 Oji-Cree (Aboriginal) 285
38 Bosnian 285
39 Malayalam 260
40 Kurdish 255

41 Hungarian 240
42 Pampangan (Kapampangan, Pampango) 230
43 Romanian 215
44 Oromo (Cushitic) 210
45 Tamil 210
46 Cree, n.o.s. (Aboriginal) 200
47 Japanese 160
48 Pashto 155
49 Albanian 150
50 Khmer (Cambodian) 125

Official languages:

English 612,595
French 11,185

Zig zagging back to the east and on to Hamilton!


Image Source: axlestudios.com

Top 50 Non-Canadian countries or places of birth

Hamilton, Canada 2016

1 United Kingdom 23,935
2 Italy (Italia) 12,010
3 India (Bhārat) 9,885
4 Poland (Polska) 7,890
5 Philippines (Pilipinas), Republic of the 7,835
6 Portugal 6,625
7 United States of America 5,700
8 Croatia (Hrvatska) 5,620
9 China, People's Republic of 5,605
10 Iraq 5,350

11 Pakistan 4,590
12 Germany (Deutschland) 4,385
13 Netherlands (Nederland) 4,025
14 Jamaica 3,500
15 Vietnam (Việt Nam), Socialist Republic of 3,160
16 Bosnia and Herzegovina 3,095
17 Romania (România) 2,425
18 Serbia (Srbija) 2,205
19 Colombia 2,200
20 Syrian Arab Republic (Syria) 2,020

21 Hungary (Magyarország) 1,905
22 Korea, Republic of (South) 1,905
23 Trinidad and Tobago 1,805
24 Iran, Islamic Republic of 1,800
25 El Salvador 1,710
26 Egypt, Arab Republic of 1,630
27 Greece (Hellenic Republic) 1,620
28 Guyana 1,610
29 South Africa, Republic of 1,255
30 Lebanese Republic (Lebanon) 1,215

31 Czech Republic (Česká Republika) 1,185
32 Ukraine 1,185
33 Afghanistan, Islamic Republic of 1,155
34 Ireland, Republic of (Éire) 1,135
35 Russian Federation (Russia) 1,120
36 Bangladesh 1,105
37 China, Hong Kong (Special Administrative Region) 925
38 Sri Lanka 900
39 México (Estados Unidos Mexicanos) 890
40 Kosovo (Kosova) 875

41 Kenya 685
42 Cambodia (Kampuchea) 655
43 Thailand 635
44 Turkey (Türkiye) 635
45 Congo (Zaire), Democratic Republic of the 630
46 Cuba 625
47 Ghana 625
48 France 620
49 Zimbabwe 610
50 Austria (Österreich) 605

Total Foreign-born: 177,075
Census Metropolitan Area (CMA) Population: 734,880

Top 50 languages spoken most often at home (non-official)

Hamilton CMA, Canada 2016

1 Arabic 6,345
2 Spanish 5,830
3 Italian 5,100
4 Mandarin 4,240
5 Punjabi (Panjabi) 4,150
6 Polish 4,005
7 Portuguese 3,540
8 Serbian 3,320
9 Urdu 2,725
10 Tagalog (Pilipino, Filipino) 2,455

11 Vietnamese 2,270
12 Croatian 2,160
13 Cantonese 2,140
14 Persian (Farsi) 1,930
15 Korean 1,475
16 Assyrian Neo-Aramaic 1,450
17 Russian 1,315
18 Romanian 1,105
19 Gujarati 1,085
20 Hungarian 955

21 Bengali 850
22 Albanian 735
23 Greek 735
24 Hindi 690
25 Somali (Cushitic) 680
26 German 630
27 Bosnian 575
28 Kurdish 560
29 Ukrainian 540
30 Czech 520

31 Turkish 470
32 Khmer (Cambodian) 465
33 Malayalam 390
34 Tamil 345
35 Chinese, n.o.s. 285
36 Macedonian 230
37 Pashto 210
38 Serbo-Croatian 200
39 Dutch 195
40 Nepali 195

41 Karenic languages 195
42 Slovene (Slovenian) 185
43 Swahili 185
44 Lao 185
45 Ilocano 170
46 Slovak 170
47 Sinhala (Sinhalese) 160
48 Chaldean Neo-Aramaic 155
49 Thai 145
50 Armenian 140

Official languages:

English 630,380
French 3,350


Are there any surprises so far, especially those of you that live in these metros?

...and that, my fellow forumers, is our adventure through Canada for tonight!

We are not done with exploring Canada though, i'll be presenting at least 8 more CMAs before we travel on to the UK!

Last edited by Urbanguy; Sep 26, 2018 at 3:48 AM.
Reply With Quote
     
     
  #20  
Old Posted Sep 26, 2018, 12:32 AM
softee's Avatar
softee softee is offline
Aimless Wanderer
 
Join Date: Jan 2003
Location: Downtown Toronto
Posts: 3,392
Quote:
Originally Posted by Urbanguy View Post
Hi Softee, both figures I used were taken from the 25% Census sample of the "Immigration and Ethnocultural Diversity Highlight Tables" which did both country of birth (in great detail) and total population (found here >> Click Me). That particular section has Oshawa as a separate entity.
Ah, good stuff, thanks for clarifying. Looking forward to the rest of your data!
__________________
Public transit is the lifeblood of every healthy city.
Reply With Quote
     
     
This discussion thread continues

Use the page links to the lower-right to go to the next page for additional posts
 
 
Reply

Go Back   SkyscraperPage Forum > Discussion Forums > City Discussions
Forum Jump


Forum Jump


All times are GMT. The time now is 7:52 AM.

     
SkyscraperPage.com - Archive - Privacy Statement - Top

Powered by vBulletin® Version 3.8.7
Copyright ©2000 - 2024, vBulletin Solutions, Inc.