Quote:
Originally Posted by yuriandrade

Resurrecting the thread, with a massive shift.
Yesterday, Australians released their 2020 estimates and Melbourne overtook Sydney as Australia's biggest city: https://www.citypopulation.de/en/australia/cities/
Both cities had started to grow faster than Australian average for the past 10 years, but Melbourne at an even faster rate. Not sure if we'll see an economic shift as well, like the one that happened in Brazil or Canada. Nonetheless, it's not every day we see a change on the top like that. |
Major Agglomerations on that site is basically the SUA - Significant Urban Area data from the ABS. This is not the headline figure we use for quoting a city's population (for 'metropolitan area' populations - we never, ever break down individual municipal populations because they're so small).
Sydney is still ahead in the headline data: GCCSA - Greater Capital City Statistical Area is our "metropolitan area" population figure.
SUA = contiguous from the city centre to the end of the sprawl
GCCSA = SUA + commuter towns within easy reach of the SUA.
explanation from the ABS
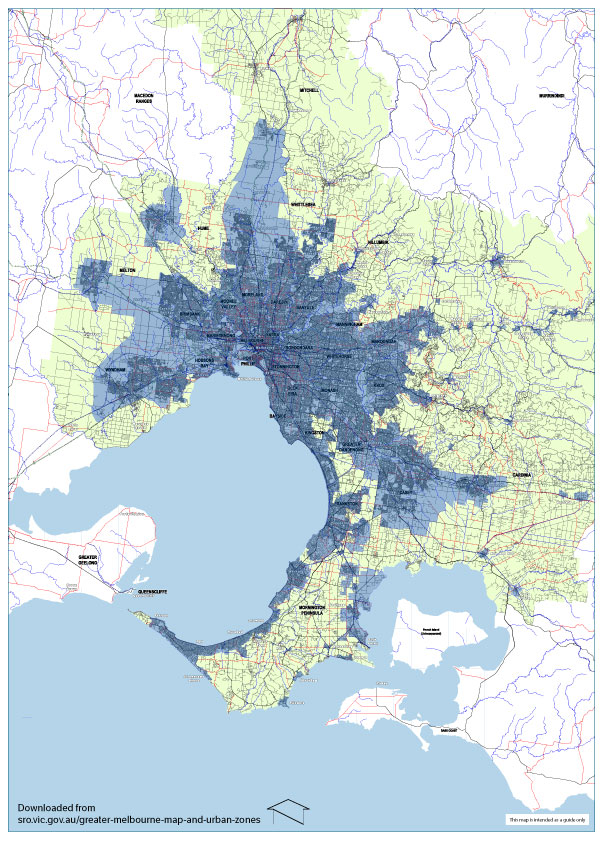
This map explains it well:
Dark blue: built-up area of Melbourne (or other statelite towns/cities - you can tell which is Melbourne and which is not).
Light blue: the extent to which Melbourne will eventually sprawl - this is all land (regardless of use - it'll include large industrial areas, green wedges, residential and commercial uses - eventually.) that is within the Urban Growth Boundary
Yellow: extent of Melbourne's GCCSA area (everything covered within yellow counts for the GCCSA population figure - the SUA figure is Dark blue).
Melbourne GCCSA: 5,159,211 <--- Melbourne is still second in rank on this widely used method/figure.
Melbourne SUA: 4,969,305 <--- the site is using this figure.
Hope that clears things up.


 Prev
Prev


 (i saw it last night)


 Linear Mode
